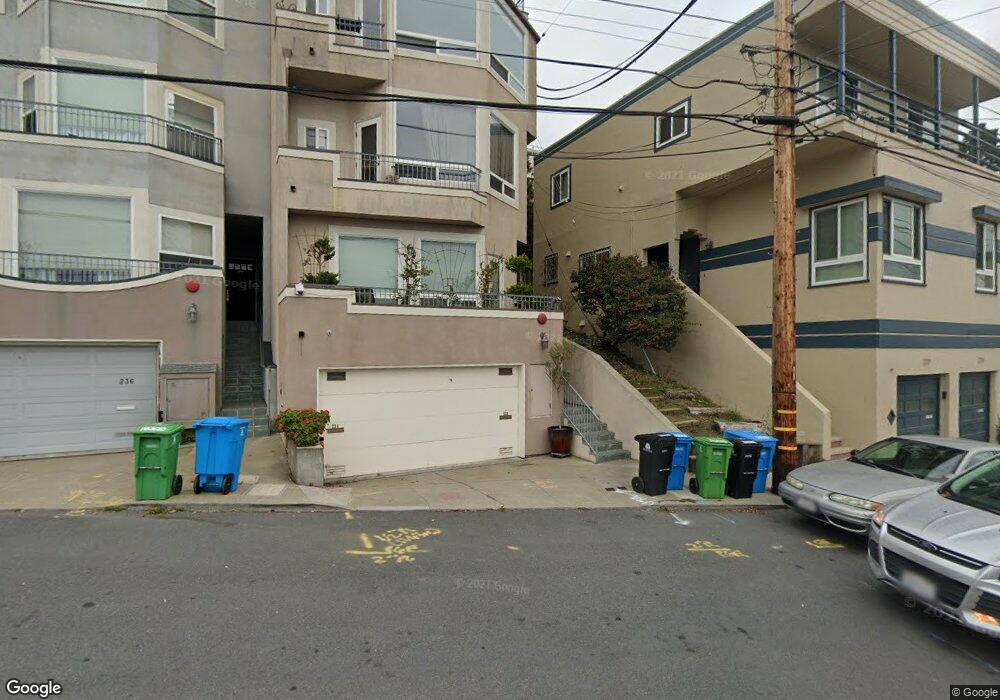
232 Grand View Ave Unit 232 San Francisco, CA 94114
Eureka Valley-Dolores Heights NeighborhoodEstimated Value: $1,434,000 - $1,827,000
3
Beds
2
Baths
1,631
Sq Ft
$1,018/Sq Ft
Est. Value
About This Home
This home is located at 232 Grand View Ave Unit 232, San Francisco, CA 94114 and is currently estimated at $1,660,377, approximately $1,018 per square foot. 232 Grand View Ave Unit 232 is a home located in San Francisco County with nearby schools including Alvarado Elementary, James Lick Middle School, and Creative Arts Charter School.
Ownership History
Date
Name
Owned For
Owner Type
Purchase Details
Closed on
Oct 20, 2004
Sold by
Flores Lawrence and Londono Miriam M
Bought by
Flores Lawrence and Londono Miriam M
Current Estimated Value
Home Financials for this Owner
Home Financials are based on the most recent Mortgage that was taken out on this home.
Original Mortgage
$502,500
Outstanding Balance
$248,362
Interest Rate
5.74%
Mortgage Type
New Conventional
Estimated Equity
$1,412,015
Purchase Details
Closed on
Nov 23, 1999
Sold by
Coyne Thomas F and Coyne Martin J
Bought by
Flores Lawrence and Londono Miriam M
Home Financials for this Owner
Home Financials are based on the most recent Mortgage that was taken out on this home.
Original Mortgage
$500,000
Interest Rate
7.95%
Purchase Details
Closed on
Jun 11, 1998
Sold by
Coyne Laurinda Renzi
Bought by
Coyne Martin J
Purchase Details
Closed on
Nov 22, 1996
Sold by
Crespo Gordon P
Bought by
Coyne Thomas F and Coyne Martin J
Create a Home Valuation Report for This Property
The Home Valuation Report is an in-depth analysis detailing your home's value as well as a comparison with similar homes in the area
Home Values in the Area
Average Home Value in this Area
Purchase History
| Date | Buyer | Sale Price | Title Company |
|---|---|---|---|
| Flores Lawrence | -- | Fidelity National Title Co | |
| Flores Lawrence | $560,000 | Chicago Title Co | |
| Coyne Martin J | -- | Chicago Title Co | |
| Coyne Thomas F | $445,000 | Chicago Title Co |
Source: Public Records
Mortgage History
| Date | Status | Borrower | Loan Amount |
|---|---|---|---|
| Open | Flores Lawrence | $502,500 | |
| Closed | Flores Lawrence | $500,000 |
Source: Public Records
Tax History Compared to Growth
Tax History
| Year | Tax Paid | Tax Assessment Tax Assessment Total Assessment is a certain percentage of the fair market value that is determined by local assessors to be the total taxable value of land and additions on the property. | Land | Improvement |
|---|---|---|---|---|
| 2025 | $10,592 | $860,686 | $516,413 | $344,273 |
| 2024 | $10,592 | $843,811 | $506,288 | $337,523 |
| 2023 | $10,426 | $827,266 | $496,361 | $330,905 |
| 2022 | $10,218 | $811,046 | $486,629 | $324,417 |
| 2021 | $10,033 | $795,144 | $477,088 | $318,056 |
| 2020 | $10,088 | $786,992 | $472,197 | $314,795 |
| 2019 | $9,743 | $771,562 | $462,939 | $308,623 |
| 2018 | $9,414 | $756,434 | $453,862 | $302,572 |
| 2017 | $9,004 | $741,603 | $444,963 | $296,640 |
| 2016 | $8,843 | $727,063 | $436,239 | $290,824 |
| 2015 | $8,732 | $716,143 | $429,687 | $286,456 |
| 2014 | $8,501 | $702,116 | $421,271 | $280,845 |
Source: Public Records
Map
Nearby Homes
- 1 Hoffman Ave Unit C
- 1 Hoffman Ave Unit A
- 3711 Market St Unit 2
- 767 Corbett Ave Unit 3
- 755 Corbett Ave
- 4454 23rd St Unit 2
- 833 Corbett Ave
- 930 Elizabeth St Unit 1
- 4229 21st St
- 3890 Market St Unit 1
- 672 Corbett Ave Unit C
- 433 Eureka St
- 4031 22nd St
- 160 Gardenside Dr Unit 101
- 945 Corbett Ave Unit 206
- 417-419 Eureka St
- 729 Douglass St
- 729 Douglass St Unit A
- 892 Corbett Ave
- 734 Elizabeth St
- 234 Grand View Ave
- 238 Grand View Ave
- 236 Grand View Ave Unit 236
- 226 Grand View Ave Unit 226
- 240 Grand View Ave
- 224 Grand View Ave Unit 224
- 220 Grand View Ave
- 246 Grand View Ave
- 3701 Market St Unit 4
- 3701 Market St Unit 3
- 3701 Market St Unit 2
- 3701 Market St Unit 1
- 216 Grand View Ave
- 3699 Market St
- 250 Grand View Ave
- 3695 Market St
- 212 Grand View Ave
- 3715 Market St
- 254 Grand View Ave
- 3691 Market St