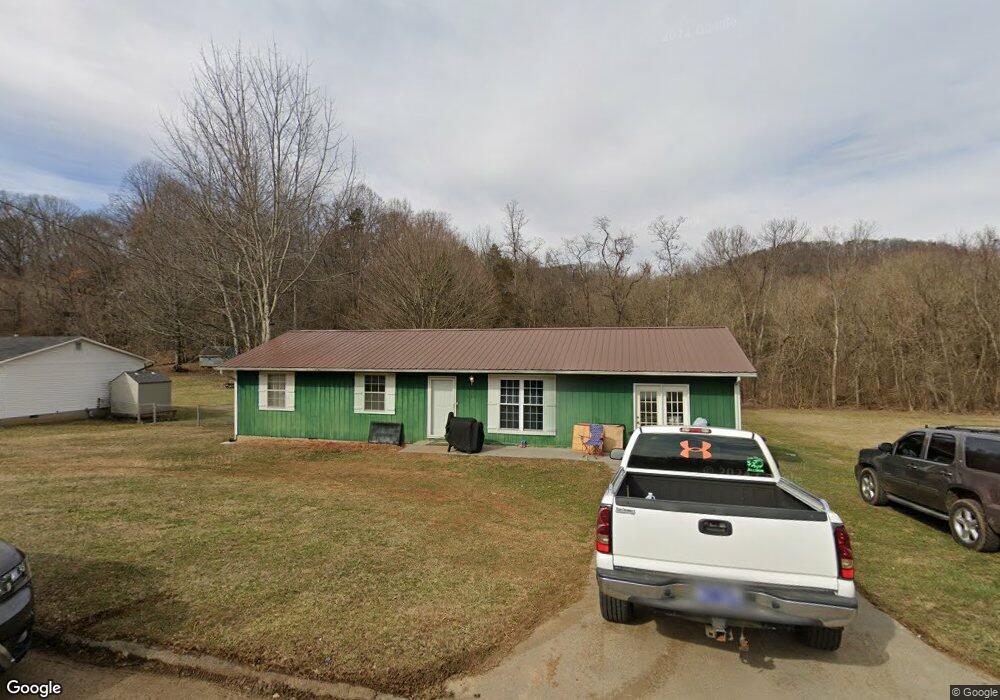
232 Hidden Valley Rd Rogersville, TN 37857
Estimated Value: $220,000 - $247,000
3
Beds
2
Baths
1,308
Sq Ft
$175/Sq Ft
Est. Value
About This Home
This home is located at 232 Hidden Valley Rd, Rogersville, TN 37857 and is currently estimated at $228,440, approximately $174 per square foot. 232 Hidden Valley Rd is a home located in Hawkins County with nearby schools including Joseph Rogers Primary School, Hawkins Elementary School, and Rogersville Middle School.
Ownership History
Date
Name
Owned For
Owner Type
Purchase Details
Closed on
Sep 9, 2020
Sold by
Mccane Catherine L Skaggs
Bought by
Cook Christopher J
Current Estimated Value
Home Financials for this Owner
Home Financials are based on the most recent Mortgage that was taken out on this home.
Original Mortgage
$101,139
Outstanding Balance
$89,754
Interest Rate
2.9%
Mortgage Type
FHA
Estimated Equity
$138,686
Purchase Details
Closed on
Jun 13, 2005
Sold by
Dan Washburn
Bought by
Skaggs Catherine L
Purchase Details
Closed on
Jun 19, 1992
Bought by
Washburn Dan and Washburn Edna
Purchase Details
Closed on
Dec 26, 1990
Bought by
Coody Claudy O and Coody Peggy S
Purchase Details
Closed on
Feb 15, 1990
Bought by
Hawkins Finance & Thrift Corp
Purchase Details
Closed on
Aug 23, 1988
Purchase Details
Closed on
May 21, 1985
Purchase Details
Closed on
Jul 2, 1984
Purchase Details
Closed on
Jul 14, 1977
Create a Home Valuation Report for This Property
The Home Valuation Report is an in-depth analysis detailing your home's value as well as a comparison with similar homes in the area
Home Values in the Area
Average Home Value in this Area
Purchase History
| Date | Buyer | Sale Price | Title Company |
|---|---|---|---|
| Cook Christopher J | $105,000 | None Available | |
| Skaggs Catherine L | $73,000 | -- | |
| Washburn Dan | $35,000 | -- | |
| Coody Claudy O | $45,300 | -- | |
| Hawkins Finance & Thrift Corp | $35,600 | -- | |
| -- | -- | -- | |
| -- | -- | -- | |
| -- | -- | -- | |
| -- | -- | -- |
Source: Public Records
Mortgage History
| Date | Status | Borrower | Loan Amount |
|---|---|---|---|
| Open | Cook Christopher J | $101,139 |
Source: Public Records
Tax History Compared to Growth
Tax History
| Year | Tax Paid | Tax Assessment Tax Assessment Total Assessment is a certain percentage of the fair market value that is determined by local assessors to be the total taxable value of land and additions on the property. | Land | Improvement |
|---|---|---|---|---|
| 2024 | $663 | $25,950 | $3,025 | $22,925 |
| 2023 | $603 | $25,950 | $0 | $0 |
| 2022 | $601 | $25,950 | $3,025 | $22,925 |
| 2021 | $563 | $25,950 | $3,025 | $22,925 |
| 2020 | $475 | $25,950 | $3,025 | $22,925 |
| 2019 | $475 | $18,750 | $2,750 | $16,000 |
| 2018 | $475 | $18,750 | $2,750 | $16,000 |
| 2017 | $475 | $18,750 | $2,750 | $16,000 |
| 2016 | $479 | $18,900 | $2,750 | $16,150 |
| 2015 | $466 | $18,900 | $2,750 | $16,150 |
| 2014 | $558 | $22,625 | $2,750 | $19,875 |
Source: Public Records
Map
Nearby Homes
- 2109 E Main St
- 2009 E Main St
- 123 Valley View Dr
- 468 Burem Rd
- 426 S Johnson Rd
- 124 Apple Ln
- 138 Stanley Valley Rd
- 175 Summit Dr
- 1313 Tennessee 70
- 1085 Old Stage Rd
- 151 Willard Lawson Rd
- 197 Devils Nose Rd
- 143 Meadowbrook Ln
- 102 Perry Smith Ln
- 166 Clarksdale Cir
- 1113 Old Stage Rd
- 112 Clarksdale Cir
- 1130 E Mckinney Ave
- 4950 Highway 11w
- 812 E Main St
- 232 Hidden Valley Dr
- 236 Hidden Valley Rd
- 236 Hidden Valley Dr
- Lot31 Hidden Valley Dr
- LOT 7 Hidden Valley Dr
- 0 Hidden Valley Dr
- 228 Hidden Valley Dr
- 000 Hidden Valley Dr
- 240 Hidden Valley Dr
- 224 Hidden Valley Rd
- 240 Hidden Valley Rd
- 227 Hidden Valley Rd
- 231 Hidden Valley Rd
- 223 Hidden Valley Rd
- 235 Hidden Valley Rd
- 223 Hidden Valley Dr
- 235 Hidden Valley Dr
- 220 Hidden Valley Rd
- 244 Hidden Valley Rd
- 219 Hidden Valley Rd