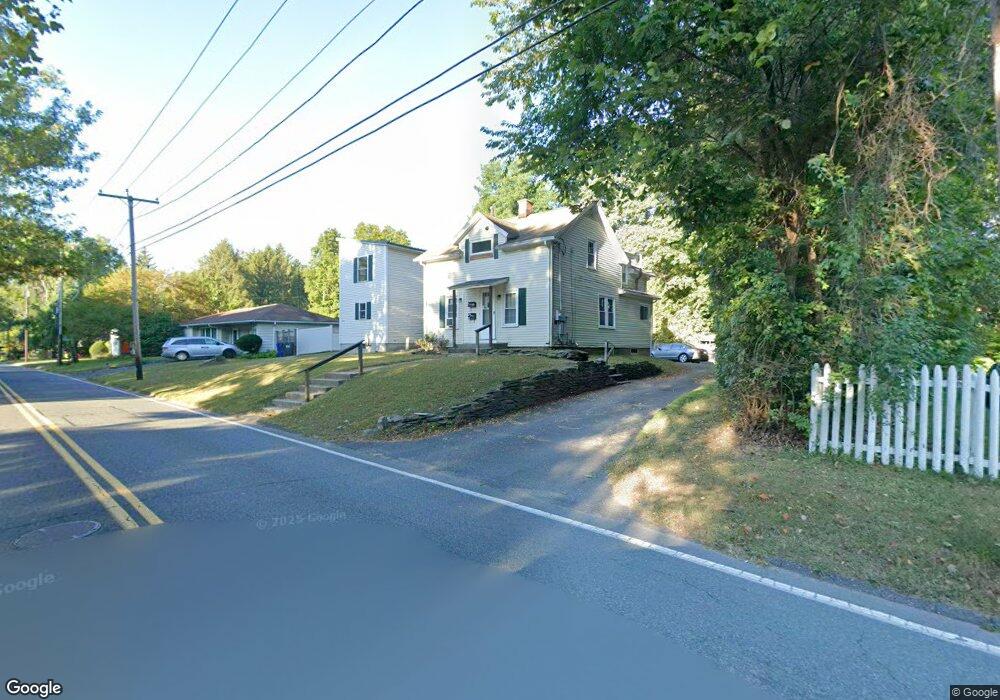
232 Jackson St Northampton, MA 01060
Estimated Value: $464,000 - $775,000
2
Beds
2
Baths
1,607
Sq Ft
$369/Sq Ft
Est. Value
About This Home
This home is located at 232 Jackson St, Northampton, MA 01060 and is currently estimated at $593,329, approximately $369 per square foot. 232 Jackson St is a home located in Hampshire County with nearby schools including Northampton High School, The Montessori School of Northampton, and Lander Grinspoon Academy.
Ownership History
Date
Name
Owned For
Owner Type
Purchase Details
Closed on
May 3, 2023
Sold by
Perfect Harmony T
Bought by
232 Jackson Street T
Current Estimated Value
Purchase Details
Closed on
Nov 20, 2003
Sold by
Redburn T
Bought by
Perfect Harmony T
Home Financials for this Owner
Home Financials are based on the most recent Mortgage that was taken out on this home.
Original Mortgage
$209,000
Interest Rate
5.98%
Mortgage Type
Purchase Money Mortgage
Create a Home Valuation Report for This Property
The Home Valuation Report is an in-depth analysis detailing your home's value as well as a comparison with similar homes in the area
Home Values in the Area
Average Home Value in this Area
Purchase History
| Date | Buyer | Sale Price | Title Company |
|---|---|---|---|
| 232 Jackson Street T | -- | None Available | |
| Perfect Harmony T | $164,000 | -- |
Source: Public Records
Mortgage History
| Date | Status | Borrower | Loan Amount |
|---|---|---|---|
| Previous Owner | Perfect Harmony T | $209,000 |
Source: Public Records
Tax History
| Year | Tax Paid | Tax Assessment Tax Assessment Total Assessment is a certain percentage of the fair market value that is determined by local assessors to be the total taxable value of land and additions on the property. | Land | Improvement |
|---|---|---|---|---|
| 2025 | $7,852 | $563,700 | $148,700 | $415,000 |
| 2024 | $7,634 | $502,600 | $148,700 | $353,900 |
| 2023 | $7,084 | $447,200 | $135,100 | $312,100 |
| 2022 | $6,047 | $338,000 | $126,300 | $211,700 |
| 2021 | $5,678 | $326,900 | $120,300 | $206,600 |
| 2020 | $5,492 | $326,900 | $120,300 | $206,600 |
| 2019 | $5,272 | $303,500 | $110,300 | $193,200 |
| 2018 | $4,972 | $291,800 | $110,300 | $181,500 |
| 2017 | $4,870 | $291,800 | $110,300 | $181,500 |
| 2016 | $4,715 | $291,800 | $110,300 | $181,500 |
| 2015 | $4,748 | $300,500 | $115,300 | $185,200 |
| 2014 | $4,625 | $300,500 | $115,300 | $185,200 |
Source: Public Records
Map
Nearby Homes
- 289 Hatfield St
- 0 Terrace Ln
- 80 Damon Rd Unit 5104
- 80 Damon Rd Unit 4302
- 88 Pines Edge Dr Unit 88
- 61 Woodlawn Ave
- 575 Bridge Rd Unit 12-7
- 575 Bridge Rd Unit 10-5
- 61 Crescent St Unit 8
- 61 Crescent St Unit 7
- 37 Finn St
- 13A Finn St
- 22 Woodbine Ave
- 20 View Ave Unit A
- 30 View Ave
- 63 Riverside Dr
- 35 Hubbard Ave
- 218 Elm St
- 32 Stonewall Dr
- 61 Harrison Ave
Your Personal Tour Guide
Ask me questions while you tour the home.