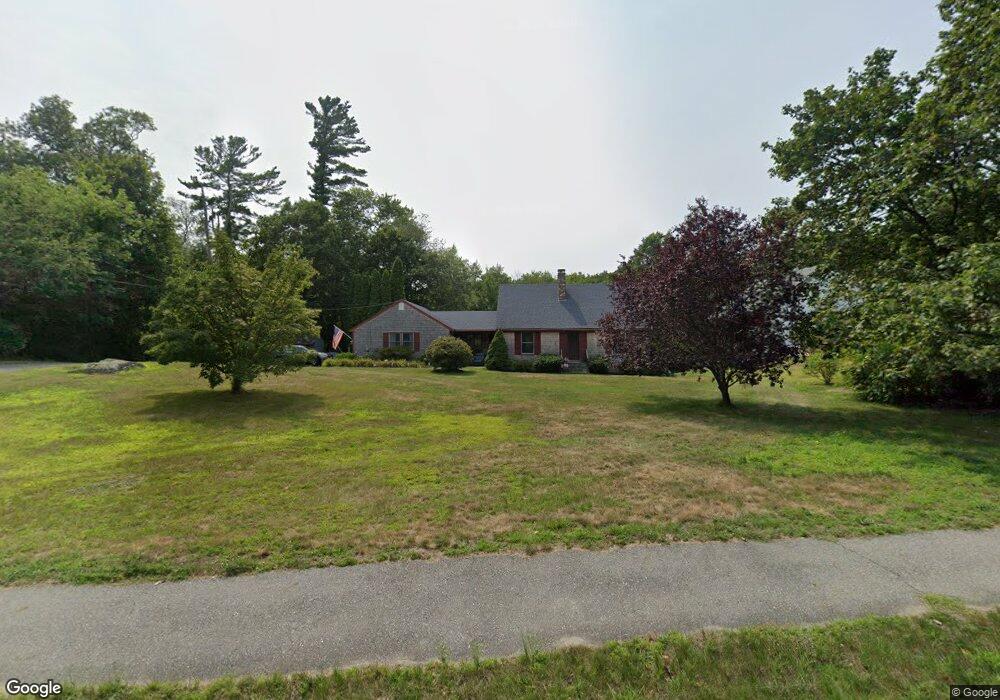
232 Locust St Danvers, MA 01923
Estimated Value: $751,000 - $807,000
3
Beds
2
Baths
2,111
Sq Ft
$366/Sq Ft
Est. Value
About This Home
This home is located at 232 Locust St, Danvers, MA 01923 and is currently estimated at $772,575, approximately $365 per square foot. 232 Locust St is a home located in Essex County with nearby schools including Danvers High School and North Shore Christian School.
Ownership History
Date
Name
Owned For
Owner Type
Purchase Details
Closed on
Oct 17, 2024
Sold by
Leblanc John V and Leblanc Marta J
Bought by
Jm Leblanc Rt and Leblanc
Current Estimated Value
Purchase Details
Closed on
Jan 20, 1976
Bought by
Leblanc John and Leblanc Marta J
Create a Home Valuation Report for This Property
The Home Valuation Report is an in-depth analysis detailing your home's value as well as a comparison with similar homes in the area
Home Values in the Area
Average Home Value in this Area
Purchase History
| Date | Buyer | Sale Price | Title Company |
|---|---|---|---|
| Jm Leblanc Rt | -- | None Available | |
| Jm Leblanc Rt | -- | None Available | |
| Leblanc John | -- | -- |
Source: Public Records
Mortgage History
| Date | Status | Borrower | Loan Amount |
|---|---|---|---|
| Previous Owner | Leblanc John | $125,000 | |
| Previous Owner | Leblanc John | $55,000 | |
| Previous Owner | Leblanc John | $35,000 | |
| Previous Owner | Leblanc John | $25,000 |
Source: Public Records
Tax History
| Year | Tax Paid | Tax Assessment Tax Assessment Total Assessment is a certain percentage of the fair market value that is determined by local assessors to be the total taxable value of land and additions on the property. | Land | Improvement |
|---|---|---|---|---|
| 2025 | $7,877 | $716,700 | $420,800 | $295,900 |
| 2024 | $7,820 | $703,900 | $420,800 | $283,100 |
| 2023 | $7,091 | $603,500 | $360,700 | $242,800 |
| 2022 | $6,941 | $548,300 | $315,700 | $232,600 |
| 2021 | $6,152 | $460,800 | $258,700 | $202,100 |
| 2020 | $6,018 | $460,800 | $258,700 | $202,100 |
| 2019 | $6,234 | $469,400 | $270,700 | $198,700 |
| 2018 | $6,078 | $448,900 | $267,700 | $181,200 |
| 2017 | $6,119 | $431,200 | $260,200 | $171,000 |
| 2016 | $5,880 | $414,100 | $248,200 | $165,900 |
| 2015 | $5,712 | $383,100 | $225,700 | $157,400 |
Source: Public Records
Map
Nearby Homes
- 4 Chatham Ln
- 6 Colby Rd
- 78 North St
- 12 Tulane Rd
- 2 Iroquois Rd
- 2 Chapel Rd
- 11 Spring St
- 55 Burley St
- 35 Locust St Unit 3
- 14 Grove St
- 22 Maple Ave
- 6 Venice St Unit B3
- 43 Hobart St Unit B
- 3 Conrad Cir
- 466 Newbury St Unit 20
- 10 Maple St
- 14 Chase St
- 19 Bridle Spur Ln
- 14 Williams St Unit C17
- 200 North St Unit 31A
Your Personal Tour Guide
Ask me questions while you tour the home.