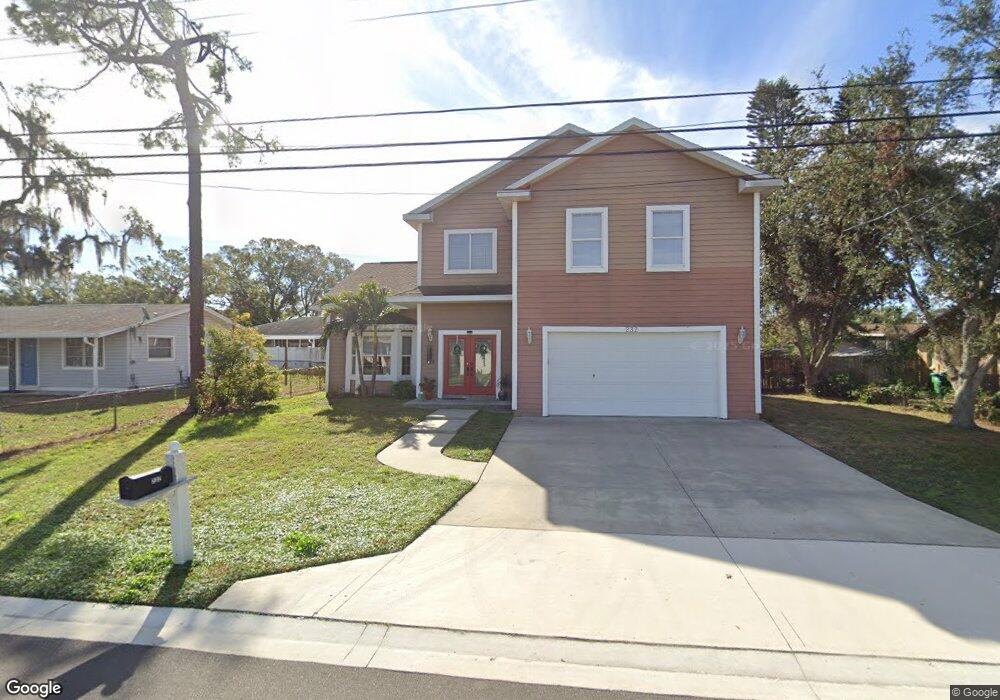
232 Maple Ave Palm Harbor, FL 34684
Estimated Value: $489,000 - $730,000
3
Beds
3
Baths
3,355
Sq Ft
$182/Sq Ft
Est. Value
About This Home
This home is located at 232 Maple Ave, Palm Harbor, FL 34684 and is currently estimated at $609,396, approximately $181 per square foot. 232 Maple Ave is a home located in Pinellas County with nearby schools including Highland Lakes Elementary School, Tarpon Springs High School, and Tarpon Springs Middle School.
Ownership History
Date
Name
Owned For
Owner Type
Purchase Details
Closed on
Nov 20, 2019
Sold by
Tawfk Sherif
Bought by
Property Trustee Services Co and 232 Maple Ave Land Trust
Current Estimated Value
Purchase Details
Closed on
Sep 7, 2012
Sold by
Pnc Bank National Association
Bought by
Tawfk Sherif
Purchase Details
Closed on
Jul 1, 2010
Sold by
Horner Harvey and Horner Margo
Bought by
National City Mortgage
Purchase Details
Closed on
Nov 22, 2006
Sold by
Scott Daryl and Lucas Kathleen Erika
Bought by
Horner Harvey and Horner Margo
Home Financials for this Owner
Home Financials are based on the most recent Mortgage that was taken out on this home.
Original Mortgage
$315,000
Interest Rate
7.25%
Mortgage Type
Construction
Purchase Details
Closed on
May 17, 2005
Sold by
Hoppe Boyd Mark
Bought by
Lucas Daryl Scott and Lucas Kathleen Erika
Create a Home Valuation Report for This Property
The Home Valuation Report is an in-depth analysis detailing your home's value as well as a comparison with similar homes in the area
Home Values in the Area
Average Home Value in this Area
Purchase History
| Date | Buyer | Sale Price | Title Company |
|---|---|---|---|
| Property Trustee Services Co | -- | Attorney | |
| Tawfk Sherif | $140,000 | Attorney | |
| National City Mortgage | -- | Attorney | |
| Horner Harvey | $70,000 | Title Svcs Of Tampa Bay | |
| Lucas Daryl Scott | $64,000 | Wollinka & Wollinka Title In |
Source: Public Records
Mortgage History
| Date | Status | Borrower | Loan Amount |
|---|---|---|---|
| Previous Owner | Horner Harvey | $315,000 |
Source: Public Records
Tax History
| Year | Tax Paid | Tax Assessment Tax Assessment Total Assessment is a certain percentage of the fair market value that is determined by local assessors to be the total taxable value of land and additions on the property. | Land | Improvement |
|---|---|---|---|---|
| 2025 | $7,744 | $517,778 | $93,608 | $424,170 |
| 2024 | $7,169 | $443,316 | $102,532 | $340,784 |
| 2023 | $7,169 | $401,114 | $109,514 | $291,600 |
| 2022 | $6,481 | $350,465 | $110,839 | $239,626 |
| 2021 | $6,298 | $326,991 | $0 | $0 |
| 2020 | $5,797 | $294,166 | $0 | $0 |
| 2019 | $5,169 | $293,144 | $69,368 | $223,776 |
| 2018 | $4,705 | $259,556 | $0 | $0 |
| 2017 | $4,395 | $240,983 | $0 | $0 |
| 2016 | $4,096 | $221,993 | $0 | $0 |
| 2015 | $3,949 | $217,172 | $0 | $0 |
| 2014 | -- | $208,586 | $0 | $0 |
Source: Public Records
Map
Nearby Homes
- 183 Philadelphia Blvd Unit 22
- 226 Maple Ave
- 12 Lake Shore Dr
- 198 Philadelphia Blvd Unit 11
- 66 Lake Shore Dr
- 210 Philadelphia Ct
- 65 Harbor Way Unit 21
- 47 Delaware Ct Unit 10
- 105 Freedom Ct Unit 30
- 40 Concord Ln
- 72 Lake Shore Dr
- 31 Revere Way Unit 23
- 208 W Canal Dr
- 57 Harbor Way Unit 24
- 29 Cypress Dr
- 127 Independence Ave
- 270 Philadelphia Blvd Unit 49
- 51 Lexington Ct Unit 13
- 140 Independence Ave Unit 11
- 216 Independence Ave Unit 15
- 231 Maple Ave
- 233 Maple Ave
- 57 Lake Shore Dr
- 58 Lake Shore Dr
- 56 Lake Shore Dr
- 275 Maple Ave
- 230 Maple Ave
- 234 Maple Ave
- 273 Maple Ave
- 55 Lake Shore Dr
- 276 Maple Ave
- 272 Maple Ave
- 20 Lake Shore Dr
- 21 Lake Shore Dr
- 277 Maple Ave
- 60 Lake Shore Dr
- 19 Lake Shore Dr
- 271 Maple Ave
- 54 Lake Shore Dr
- 22 Lake Shore Dr
Your Personal Tour Guide
Ask me questions while you tour the home.