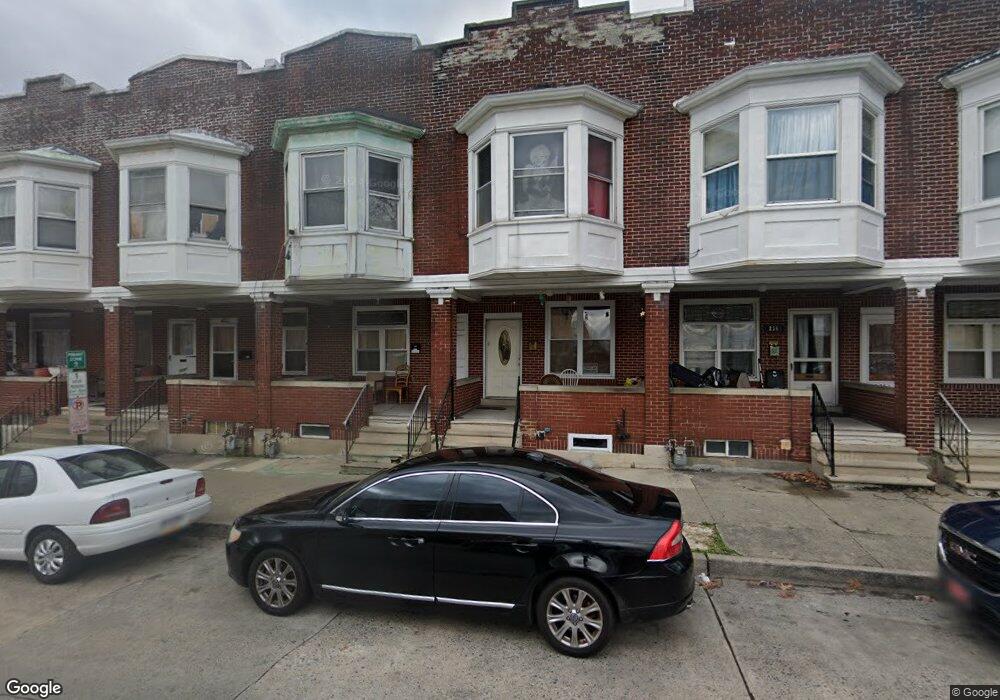
232 N 5th St Allentown, PA 18102
Center City NeighborhoodEstimated Value: $168,000 - $212,774
3
Beds
2
Baths
1,670
Sq Ft
$119/Sq Ft
Est. Value
About This Home
This home is located at 232 N 5th St, Allentown, PA 18102 and is currently estimated at $198,944, approximately $119 per square foot. 232 N 5th St is a home located in Lehigh County with nearby schools including Central Elementary School, San Rafael Junior High School, and Harrison-Morton Middle School.
Ownership History
Date
Name
Owned For
Owner Type
Purchase Details
Closed on
Jan 23, 2017
Sold by
Serrano Jose S and Villatoro Lucia
Bought by
Elias Charbel A
Current Estimated Value
Purchase Details
Closed on
Sep 26, 1996
Sold by
Gardner John T
Bought by
Serrano Jose S
Purchase Details
Closed on
Aug 12, 1996
Sold by
Sec Of Housing & Urban Development
Bought by
Gardner John T
Purchase Details
Closed on
Jan 22, 1996
Sold by
Stayer Thomas K
Bought by
Sec Of Housing & Urban Development
Purchase Details
Closed on
May 29, 1987
Bought by
Stayer Thomas K
Create a Home Valuation Report for This Property
The Home Valuation Report is an in-depth analysis detailing your home's value as well as a comparison with similar homes in the area
Home Values in the Area
Average Home Value in this Area
Purchase History
| Date | Buyer | Sale Price | Title Company |
|---|---|---|---|
| Elias Charbel A | $40,000 | None Available | |
| Serrano Jose S | $39,900 | -- | |
| Gardner John T | $21,100 | -- | |
| Sec Of Housing & Urban Development | -- | -- | |
| Stayer Thomas K | $42,900 | -- |
Source: Public Records
Tax History Compared to Growth
Tax History
| Year | Tax Paid | Tax Assessment Tax Assessment Total Assessment is a certain percentage of the fair market value that is determined by local assessors to be the total taxable value of land and additions on the property. | Land | Improvement |
|---|---|---|---|---|
| 2025 | $2,565 | $80,300 | $4,500 | $75,800 |
| 2024 | $2,565 | $80,300 | $4,500 | $75,800 |
| 2023 | $2,565 | $80,300 | $4,500 | $75,800 |
| 2022 | $2,474 | $80,300 | $75,800 | $4,500 |
| 2021 | $2,423 | $80,300 | $4,500 | $75,800 |
| 2020 | $2,359 | $80,300 | $4,500 | $75,800 |
| 2019 | $2,320 | $80,300 | $4,500 | $75,800 |
| 2018 | $2,172 | $80,300 | $4,500 | $75,800 |
| 2017 | $2,116 | $80,300 | $4,500 | $75,800 |
| 2016 | -- | $80,300 | $4,500 | $75,800 |
| 2015 | -- | $80,300 | $4,500 | $75,800 |
| 2014 | -- | $80,300 | $4,500 | $75,800 |
Source: Public Records
Map
Nearby Homes