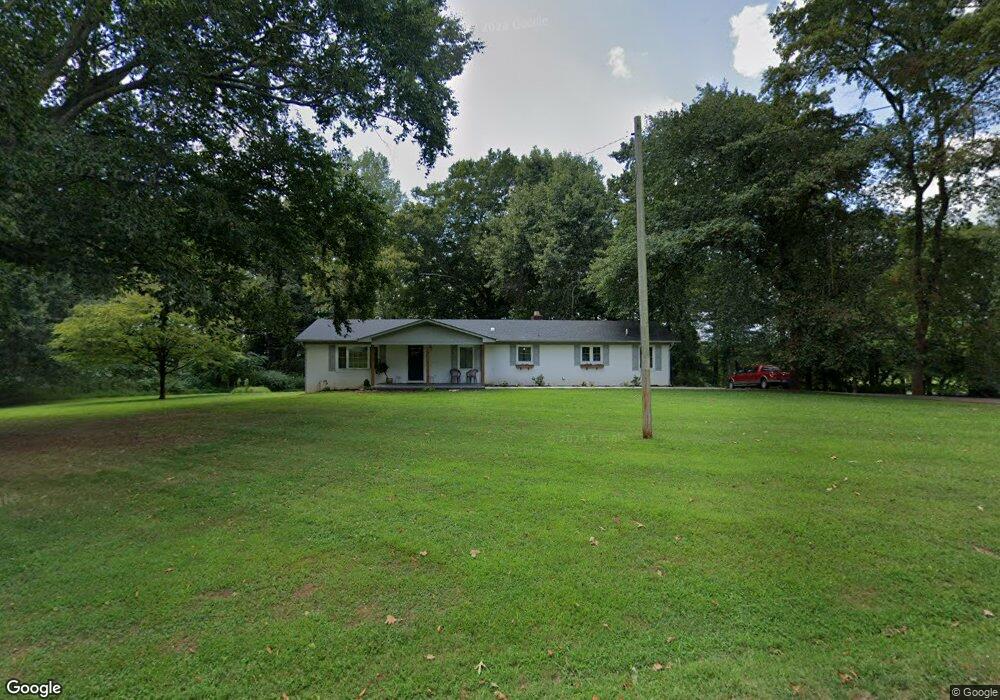
232 Ray Broyles Rd Sparta, TN 38583
Estimated Value: $258,000 - $382,000
3
Beds
2
Baths
1,512
Sq Ft
$204/Sq Ft
Est. Value
About This Home
This home is located at 232 Ray Broyles Rd, Sparta, TN 38583 and is currently estimated at $308,728, approximately $204 per square foot. 232 Ray Broyles Rd is a home located in White County with nearby schools including Findlay Elementary School, White County Middle School, and White County High School.
Ownership History
Date
Name
Owned For
Owner Type
Purchase Details
Closed on
Mar 13, 2020
Sold by
Davis Tim
Bought by
Dickerson Landon T and Dickerson Terri E
Current Estimated Value
Home Financials for this Owner
Home Financials are based on the most recent Mortgage that was taken out on this home.
Original Mortgage
$36,000
Outstanding Balance
$33,056
Interest Rate
6%
Mortgage Type
New Conventional
Estimated Equity
$275,672
Purchase Details
Closed on
Mar 3, 2020
Sold by
Hamilton Donna
Bought by
Davis Tim
Home Financials for this Owner
Home Financials are based on the most recent Mortgage that was taken out on this home.
Original Mortgage
$36,000
Outstanding Balance
$33,056
Interest Rate
6%
Mortgage Type
New Conventional
Estimated Equity
$275,672
Purchase Details
Closed on
Jan 12, 1996
Bought by
Burgess Minnie Ethel
Purchase Details
Closed on
Mar 9, 1982
Bought by
Burgess Jim Frank and Burgess Minnie E
Purchase Details
Closed on
Jan 1, 1981
Create a Home Valuation Report for This Property
The Home Valuation Report is an in-depth analysis detailing your home's value as well as a comparison with similar homes in the area
Home Values in the Area
Average Home Value in this Area
Purchase History
| Date | Buyer | Sale Price | Title Company |
|---|---|---|---|
| Dickerson Landon T | $59,000 | None Available | |
| Davis Tim | $35,000 | None Available | |
| Burgess Minnie Ethel | $70,200 | -- | |
| Burgess Jim Frank | -- | -- | |
| -- | $65,000 | -- |
Source: Public Records
Mortgage History
| Date | Status | Borrower | Loan Amount |
|---|---|---|---|
| Open | Davis Tim | $36,000 |
Source: Public Records
Tax History Compared to Growth
Tax History
| Year | Tax Paid | Tax Assessment Tax Assessment Total Assessment is a certain percentage of the fair market value that is determined by local assessors to be the total taxable value of land and additions on the property. | Land | Improvement |
|---|---|---|---|---|
| 2025 | $938 | $85,050 | $0 | $0 |
| 2024 | $938 | $45,775 | $4,000 | $41,775 |
| 2023 | $713 | $45,775 | $4,000 | $41,775 |
| 2022 | $713 | $34,775 | $4,000 | $30,775 |
| 2021 | $713 | $34,775 | $4,000 | $30,775 |
| 2020 | $713 | $34,775 | $4,000 | $30,775 |
| 2019 | $575 | $28,025 | $3,750 | $24,275 |
| 2018 | $575 | $28,025 | $3,750 | $24,275 |
| 2017 | $575 | $28,025 | $3,750 | $24,275 |
| 2016 | $575 | $28,025 | $3,750 | $24,275 |
| 2015 | $518 | $28,025 | $3,750 | $24,275 |
| 2014 | -- | $28,025 | $3,750 | $24,275 |
| 2013 | -- | $28,950 | $3,750 | $25,200 |
Source: Public Records
Map
Nearby Homes
- 548 Turntable Rd
- 548 Turn Table Rd
- 210 Gillen Dr
- 202 Gillen Dr
- 00 N Spring St
- 147 Sunrise Ridge Dr
- 1178 Ray Broyles Rd
- 249 N Spring St
- 0 Millers Point Rd
- 613 Hale St
- 0 Roberts Matthews Hwy
- 00 Roberts Matthews Hwy
- 311 Officer Dr
- 0 Moore St
- 23 Acres Moore St
- 23 AC Moore St
- 0 N Main St
- 113 N Spring St
- 731 Howell St
- 301 W Everett St
- 159 Oak Forest Ln
- 2897 Coal Rd
- 79 Coal Rd
- 00 Harleys Ridge
- 00 Cotton Rd_5 02 Acs
- Lot 55 High Rock @ the Bluffs
- Lot 80 @ the Bluffs
- Lot 80 Bluffs @ Rocky Ridge
- 279 Oak Forest Ln
- 306 Ray Broyles Rd
- 227 Ray Broyles Rd
- 430 Turn Table Rd
- 502 Turn Table Rd
- 508 Turn Table Rd
- 380 Ray Broyles Rd
- 11 Clearwater Square Unit 11
- 11 Clearwater Square
- 000 Southard Tollisontown
- Lot 34 Deer Trace
- 45 Campsite Hollingsworth Slough Rd