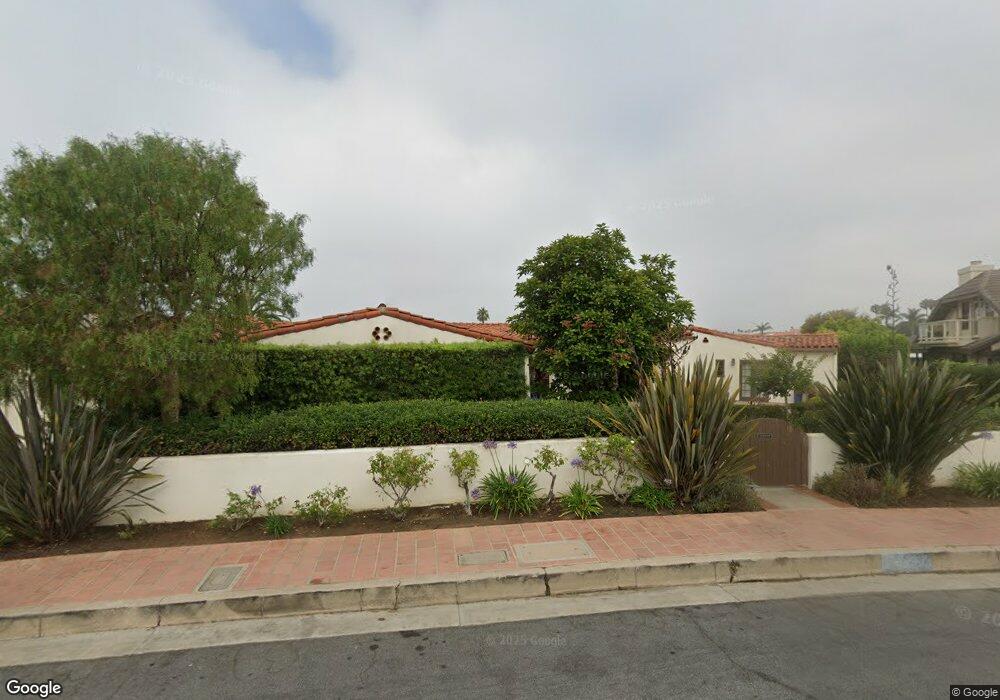
232 Trafalgar Ln San Clemente, CA 92672
Southwest San Clemente NeighborhoodEstimated Value: $4,343,000 - $5,889,000
5
Beds
7
Baths
4,708
Sq Ft
$1,132/Sq Ft
Est. Value
About This Home
This home is located at 232 Trafalgar Ln, San Clemente, CA 92672 and is currently estimated at $5,329,682, approximately $1,132 per square foot. 232 Trafalgar Ln is a home located in Orange County with nearby schools including Concordia Elementary School, Shorecliffs Middle School, and San Clemente High School.
Ownership History
Date
Name
Owned For
Owner Type
Purchase Details
Closed on
Dec 13, 2005
Sold by
Mckernan Steffen K and Glynn Ellen
Bought by
Mckernan Steffen Keleher and Glynn Ellen Julienne
Current Estimated Value
Purchase Details
Closed on
Oct 17, 2000
Sold by
Levi Jerome M and Levi Shirley M
Bought by
Mckernan Steffen K and Glynn Ellen
Home Financials for this Owner
Home Financials are based on the most recent Mortgage that was taken out on this home.
Original Mortgage
$800,000
Interest Rate
7.86%
Purchase Details
Closed on
Feb 7, 1997
Sold by
Levi Jerome M and Levi Shirley M
Bought by
Levi Jerome M and Levi Shirley M
Purchase Details
Closed on
Sep 13, 1996
Sold by
Levi Jerome M and Levi Shirley M
Bought by
Levi Jerome M and Levi Shirley M
Purchase Details
Closed on
Aug 6, 1996
Sold by
Levi Jerome M and Levi Shirley M
Bought by
Levi Jerome M and Levi Shirley M
Create a Home Valuation Report for This Property
The Home Valuation Report is an in-depth analysis detailing your home's value as well as a comparison with similar homes in the area
Home Values in the Area
Average Home Value in this Area
Purchase History
| Date | Buyer | Sale Price | Title Company |
|---|---|---|---|
| Mckernan Steffen Keleher | -- | -- | |
| Mckernan Steffen K | $1,000,000 | Commonwealth Land Title Co | |
| Levi Jerome M | -- | -- | |
| Levi Jerome M | -- | Gateway Title Company | |
| Levi Jerome M | -- | -- |
Source: Public Records
Mortgage History
| Date | Status | Borrower | Loan Amount |
|---|---|---|---|
| Previous Owner | Mckernan Steffen K | $800,000 |
Source: Public Records
Tax History Compared to Growth
Tax History
| Year | Tax Paid | Tax Assessment Tax Assessment Total Assessment is a certain percentage of the fair market value that is determined by local assessors to be the total taxable value of land and additions on the property. | Land | Improvement |
|---|---|---|---|---|
| 2025 | $16,679 | $1,686,820 | $1,233,900 | $452,920 |
| 2024 | $16,679 | $1,653,746 | $1,209,706 | $444,040 |
| 2023 | $16,324 | $1,621,320 | $1,185,986 | $435,334 |
| 2022 | $16,012 | $1,589,530 | $1,162,731 | $426,799 |
| 2021 | $15,702 | $1,558,363 | $1,139,932 | $418,431 |
| 2020 | $15,545 | $1,542,384 | $1,128,243 | $414,141 |
| 2019 | $15,237 | $1,512,142 | $1,106,121 | $406,021 |
| 2018 | $14,944 | $1,482,493 | $1,084,433 | $398,060 |
| 2017 | $14,651 | $1,453,425 | $1,063,170 | $390,255 |
| 2016 | $14,369 | $1,424,927 | $1,042,324 | $382,603 |
| 2015 | $14,152 | $1,403,524 | $1,026,668 | $376,856 |
| 2014 | $13,880 | $1,376,031 | $1,006,557 | $369,474 |
Source: Public Records
Map
Nearby Homes
- 217 Vista Marina
- 501 Elena Ln Unit B
- 117 Santa Ana Ln Unit A
- 229 W Paseo de Cristobal
- 420 Monterey Ln Unit R16
- 144 Esplanade
- 251 Avenida Madrid
- 147 Trafalgar Ln
- 243 Avenida Madrid
- 229 W Avenida Cordoba
- 405 Avenida Granada Unit 212
- 405 Avenida Granada Unit 202
- 210 W Avenida Gaviota
- 229 Avenida Monterey Unit B
- 229 Avenida Monterey Unit A
- 221 Avenida Monterey
- 251 Avenida Del Mar
- 423 Avenida Granada Unit 54
- 306 Avenida Cabrillo
- 309 W Avenida Palizada
- 240 Trafalgar Ln
- 230 Trafalgar Ln
- 238 Esplanade
- 231 Trafalgar Ln
- 228 Trafalgar Ln
- 229 Trafalgar Ln
- 242 Esplanade
- 236 Esplanade
- 227 Trafalgar Ln
- 226 Trafalgar Ln
- 244 Esplanade
- 228 Avenida Barcelona
- 226 Avenida Barcelona
- 225 Trafalgar Ln
- 204 Calle Conchita
- 321 Cazador Ln
- 323 Cazador Ln
- 319 Cazador Ln Unit A
- 319 Cazador Ln
- 325 Cazador Ln