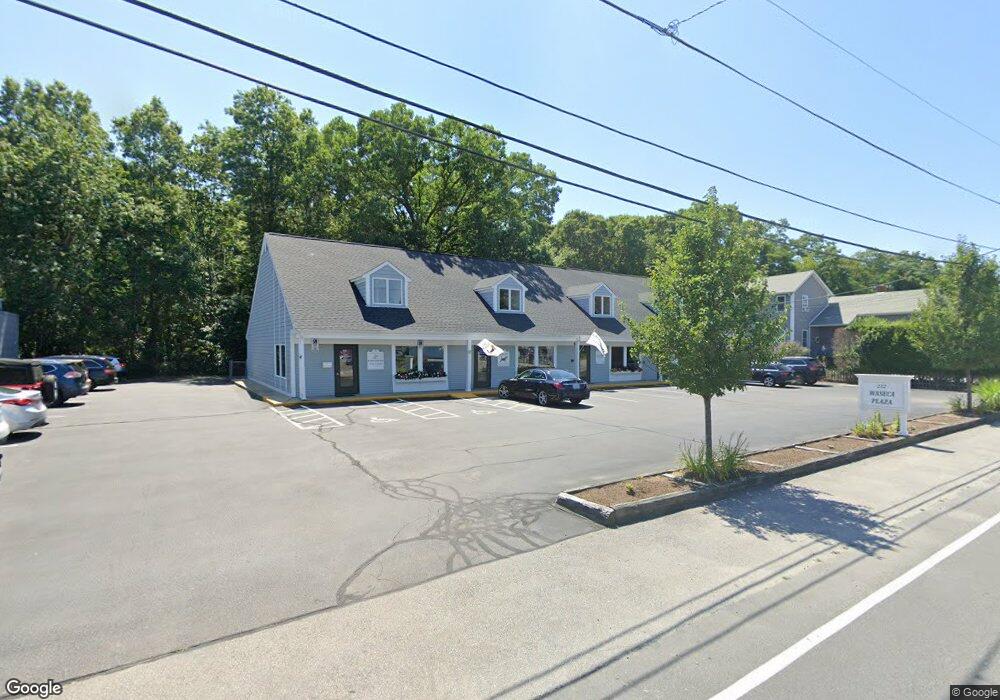
232 Waseca Ave Barrington, RI 02806
North Barrington NeighborhoodEstimated Value: $839,636
--
Bed
--
Bath
5,800
Sq Ft
$145/Sq Ft
Est. Value
About This Home
This home is located at 232 Waseca Ave, Barrington, RI 02806 and is currently estimated at $839,636, approximately $144 per square foot. 232 Waseca Ave is a home located in Bristol County with nearby schools including Barrington High School, Barrington Christian Academy, and St. Andrews School.
Ownership History
Date
Name
Owned For
Owner Type
Purchase Details
Closed on
Apr 18, 2025
Sold by
Nali Bay Llc
Bought by
232 Waseca Avenue Llc
Current Estimated Value
Home Financials for this Owner
Home Financials are based on the most recent Mortgage that was taken out on this home.
Original Mortgage
$626,250
Outstanding Balance
$623,470
Interest Rate
6.65%
Mortgage Type
Purchase Money Mortgage
Estimated Equity
$216,166
Purchase Details
Closed on
Mar 29, 2023
Sold by
Princes Hill Reatly Llc
Bought by
Nali Bay Llc
Create a Home Valuation Report for This Property
The Home Valuation Report is an in-depth analysis detailing your home's value as well as a comparison with similar homes in the area
Home Values in the Area
Average Home Value in this Area
Purchase History
| Date | Buyer | Sale Price | Title Company |
|---|---|---|---|
| 232 Waseca Avenue Llc | $830,000 | None Available | |
| 232 Waseca Avenue Llc | $830,000 | None Available | |
| Nali Bay Llc | $720,000 | None Available | |
| Nali Bay Llc | $720,000 | None Available |
Source: Public Records
Mortgage History
| Date | Status | Borrower | Loan Amount |
|---|---|---|---|
| Open | 232 Waseca Avenue Llc | $626,250 | |
| Closed | 232 Waseca Avenue Llc | $626,250 |
Source: Public Records
Tax History Compared to Growth
Tax History
| Year | Tax Paid | Tax Assessment Tax Assessment Total Assessment is a certain percentage of the fair market value that is determined by local assessors to be the total taxable value of land and additions on the property. | Land | Improvement |
|---|---|---|---|---|
| 2025 | $10,186 | $664,000 | $287,000 | $377,000 |
| 2024 | $9,794 | $664,000 | $287,000 | $377,000 |
| 2023 | $12,911 | $636,000 | $205,000 | $431,000 |
| 2022 | $12,497 | $636,000 | $205,000 | $431,000 |
| 2021 | $12,179 | $636,000 | $205,000 | $431,000 |
| 2020 | $12,582 | $602,000 | $178,000 | $424,000 |
| 2019 | $12,100 | $602,000 | $178,000 | $424,000 |
| 2018 | $11,739 | $602,000 | $178,000 | $424,000 |
| 2017 | $11,260 | $563,000 | $170,500 | $392,500 |
| 2016 | $10,387 | $563,000 | $170,500 | $392,500 |
| 2015 | $10,275 | $563,000 | $170,500 | $392,500 |
| 2014 | $7,975 | $435,800 | $170,500 | $265,300 |
Source: Public Records
Map
Nearby Homes