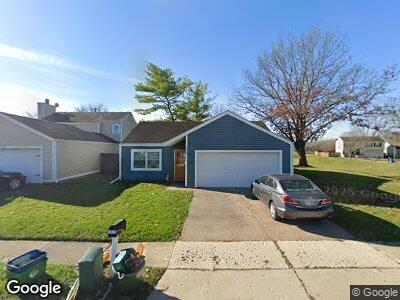
2320 Bluebell Ct Aurora, IL 60506
Edgelawn Randall NeighborhoodEstimated Value: $278,428 - $294,000
3
Beds
2
Baths
1,284
Sq Ft
$224/Sq Ft
Est. Value
About This Home
This home is located at 2320 Bluebell Ct, Aurora, IL 60506 and is currently estimated at $287,107, approximately $223 per square foot. 2320 Bluebell Ct is a home located in Kane County with nearby schools including Hall Elementary School, Jefferson Middle School, and West Aurora High School.
Ownership History
Date
Name
Owned For
Owner Type
Purchase Details
Closed on
Dec 12, 2008
Sold by
Herzog Peter J
Bought by
Herzog Peter J and Herzog Suzanne M
Current Estimated Value
Home Financials for this Owner
Home Financials are based on the most recent Mortgage that was taken out on this home.
Original Mortgage
$150,000
Interest Rate
5.96%
Mortgage Type
New Conventional
Purchase Details
Closed on
Mar 15, 2000
Sold by
Herzog Debra K
Bought by
Herzog Peter J
Home Financials for this Owner
Home Financials are based on the most recent Mortgage that was taken out on this home.
Original Mortgage
$118,800
Interest Rate
8.43%
Purchase Details
Closed on
Jul 20, 1994
Sold by
Merchants National Bank Of Aurora
Bought by
Herzog Peter J and Herzog Debra K
Home Financials for this Owner
Home Financials are based on the most recent Mortgage that was taken out on this home.
Original Mortgage
$87,400
Interest Rate
8.41%
Create a Home Valuation Report for This Property
The Home Valuation Report is an in-depth analysis detailing your home's value as well as a comparison with similar homes in the area
Home Values in the Area
Average Home Value in this Area
Purchase History
| Date | Buyer | Sale Price | Title Company |
|---|---|---|---|
| Herzog Peter J | -- | Specialty Title | |
| Herzog Peter J | -- | First American Title Ins Co | |
| Herzog Peter J | $92,000 | Law Title Comp Inc |
Source: Public Records
Mortgage History
| Date | Status | Borrower | Loan Amount |
|---|---|---|---|
| Open | Herzog Peter J | $136,000 | |
| Closed | Herzog Peter J | $150,000 | |
| Closed | Herzog Peter J | $45,188 | |
| Closed | Herzog Peter | $47,000 | |
| Closed | Herzog Peter J | $42,000 | |
| Closed | Herzog Peter J | $13,600 | |
| Closed | Herzog Peter J | $117,000 | |
| Closed | Herzog Peter J | $118,000 | |
| Closed | Herzog Peter J | $118,800 | |
| Closed | Herzog Peter J | $87,400 |
Source: Public Records
Tax History Compared to Growth
Tax History
| Year | Tax Paid | Tax Assessment Tax Assessment Total Assessment is a certain percentage of the fair market value that is determined by local assessors to be the total taxable value of land and additions on the property. | Land | Improvement |
|---|---|---|---|---|
| 2023 | $5,479 | $71,963 | $3,835 | $68,128 |
| 2022 | $5,281 | $65,660 | $3,499 | $62,161 |
| 2021 | $5,037 | $61,131 | $3,258 | $57,873 |
| 2020 | $4,754 | $56,781 | $3,026 | $53,755 |
| 2019 | $4,558 | $52,609 | $2,804 | $49,805 |
| 2018 | $3,853 | $44,593 | $2,594 | $41,999 |
| 2017 | $3,739 | $42,329 | $2,656 | $39,673 |
| 2016 | $3,272 | $36,804 | $2,530 | $34,274 |
| 2015 | $3,270 | $32,107 | $2,176 | $29,931 |
| 2014 | $3,270 | $29,250 | $1,570 | $27,680 |
| 2013 | $3,270 | $28,318 | $1,032 | $27,286 |
Source: Public Records
Map
Nearby Homes
- 641 Independence Dr
- 2210 Sandburg Dr Unit 3
- 2180 Baker St Unit 3
- 2468 Clovertree Ct
- 1963 W Illinois Ave Unit 69
- 2416 Courtyard Cir Unit 1
- 2426 Courtyard Cir Unit 4
- 2432 Courtyard Cir Unit 1
- 1126 Village Center Pkwy Unit 6
- 2488 Golf Trail Ct
- 2449 Cambridge Dr
- 1094 Rainwood Dr Unit 1
- 80 Barn Swallow Ct
- 1730 W Galena Blvd Unit 402E
- 1677 Brightwood Place Unit 8B
- 1246 Verona Ridge Dr Unit 3
- 230 S Constitution Dr
- 831 N Glenwood Place
- 1731 Garfield Ave
- 2080 Carolyn Rd
- 2320 Bluebell Ct
- 2310 Bluebell Ct
- 2300 Bluebell Ct Unit 2
- 2290 Bluebell Ct Unit II
- 2335 Sunflower Ct
- 2291 Bittersweet Ct
- 2311 Bluebell Ct Unit 2
- 2301 Bluebell Ct
- 2321 Bluebell Ct
- 2280 Bluebell Ct
- 2330 Bittersweet Ct
- 2345 Sunflower Ct
- 2291 Bluebell Ct
- 2281 Bittersweet Ct
- 2320 Bittersweet Ct Unit 2
- 2310 Bittersweet Ct Unit II
- 2281 Bluebell Ct
- 2300 Bittersweet Ct
- 2271 Bittersweet Ct
- 2270 Bluebell Ct