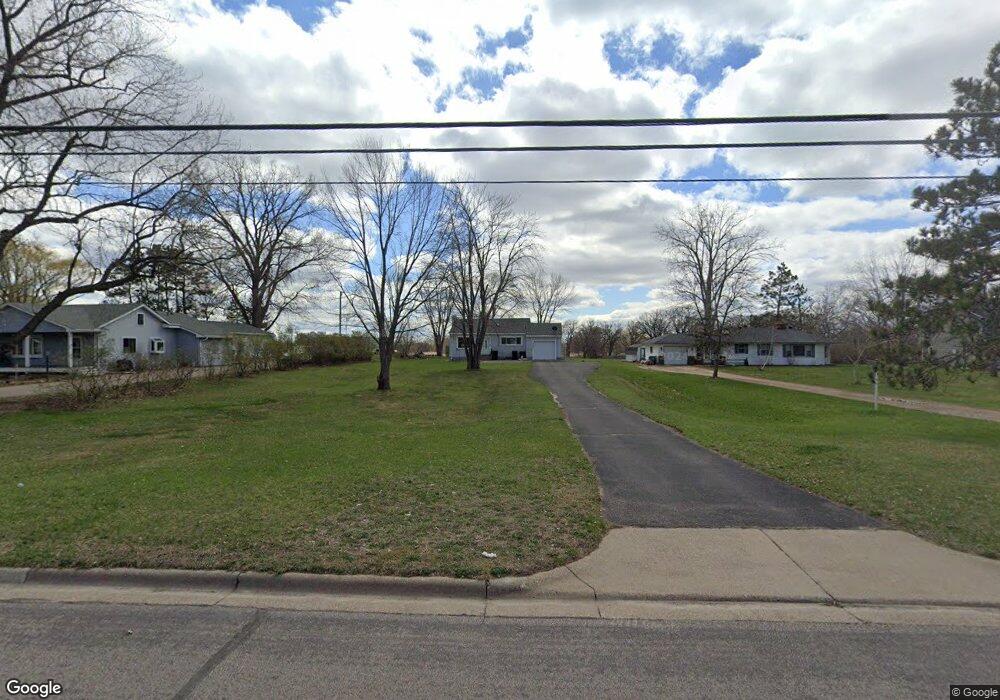
2320 Coon Rapids Blvd NW Coon Rapids, MN 55433
Estimated Value: $250,000 - $271,000
1
Bed
1
Bath
720
Sq Ft
$362/Sq Ft
Est. Value
About This Home
This home is located at 2320 Coon Rapids Blvd NW, Coon Rapids, MN 55433 and is currently estimated at $260,332, approximately $361 per square foot. 2320 Coon Rapids Blvd NW is a home located in Anoka County with nearby schools including Lucile Bruner Elementary School, Mississippi Elementary School, and Laughlin Junior/Senior High School.
Ownership History
Date
Name
Owned For
Owner Type
Purchase Details
Closed on
Dec 11, 2012
Sold by
Federal National Mortgage Association
Bought by
Frank Melinda K
Current Estimated Value
Home Financials for this Owner
Home Financials are based on the most recent Mortgage that was taken out on this home.
Original Mortgage
$77,900
Outstanding Balance
$53,896
Interest Rate
3.34%
Mortgage Type
New Conventional
Estimated Equity
$206,436
Purchase Details
Closed on
Sep 25, 2007
Sold by
Hsbc Mortgage Services Inc
Bought by
Michael Randa
Home Financials for this Owner
Home Financials are based on the most recent Mortgage that was taken out on this home.
Original Mortgage
$135,000
Interest Rate
6.49%
Mortgage Type
New Conventional
Purchase Details
Closed on
Aug 15, 2003
Sold by
Harms Harold and Harms Maxine
Bought by
Altman Jamie and Altman Jeanne
Create a Home Valuation Report for This Property
The Home Valuation Report is an in-depth analysis detailing your home's value as well as a comparison with similar homes in the area
Home Values in the Area
Average Home Value in this Area
Purchase History
| Date | Buyer | Sale Price | Title Company |
|---|---|---|---|
| Frank Melinda K | -- | Signature Title Midwest Serv | |
| Michael Randa | $135,000 | -- | |
| Altman Jamie | $153,470 | -- |
Source: Public Records
Mortgage History
| Date | Status | Borrower | Loan Amount |
|---|---|---|---|
| Open | Frank Melinda K | $77,900 | |
| Previous Owner | Michael Randa | $135,000 |
Source: Public Records
Tax History Compared to Growth
Tax History
| Year | Tax Paid | Tax Assessment Tax Assessment Total Assessment is a certain percentage of the fair market value that is determined by local assessors to be the total taxable value of land and additions on the property. | Land | Improvement |
|---|---|---|---|---|
| 2025 | $2,099 | $219,000 | $89,800 | $129,200 |
| 2024 | $2,099 | $214,600 | $86,800 | $127,800 |
| 2023 | $1,878 | $211,800 | $82,800 | $129,000 |
| 2022 | $1,799 | $202,900 | $66,900 | $136,000 |
| 2021 | $1,751 | $175,600 | $66,900 | $108,700 |
| 2020 | $1,780 | $167,900 | $64,900 | $103,000 |
| 2019 | $1,594 | $164,200 | $61,800 | $102,400 |
| 2018 | $1,648 | $145,700 | $0 | $0 |
| 2017 | $1,411 | $133,800 | $0 | $0 |
| 2016 | $1,439 | $115,200 | $0 | $0 |
| 2015 | $1,382 | $115,200 | $50,600 | $64,600 |
| 2014 | -- | $96,100 | $38,700 | $57,400 |
Source: Public Records
Map
Nearby Homes
- 2201 108th Ave NW
- 10648 Wren St NW
- 2400 108th Ave NW
- 10616 Arrowhead St NW
- 11000 Swallow St NW
- 1920 108th Ln NW
- 10309 Yukon St NW
- 11036 Hanson Blvd NW Unit 20
- 2001 103rd Ln NW
- 2633 103rd Ave NW
- 2721 109th Ave NW
- 1900 Coon Rapids Blvd NW Unit 1
- 10136 Uplander St NW
- 2728 109th Ln NW
- 10200 Mississippi Blvd NW
- 10658 Hummingbird St NW
- 10634 Hummingbird St NW
- 2965 108th Ln NW
- 11409 Quinn St NW
- 11424 Hanson Blvd NW
- 2320 2320 Coon Rapids-Boulevard-nw
- 2310 Coon Rapids Blvd NW
- 2330 Coon Rapids Blvd NW
- 2340 Coon Rapids Blvd NW
- 2300 Coon Rapids Blvd NW
- 2260 Coon Rapids Blvd NW
- 2271 Coon Rapids Blvd NW
- 10709 Thrush St NW
- 2261 Coon Rapids Blvd NW
- 10661 Verdin St NW
- 10663 Verdin St NW
- 10708 Thrush St NW
- 2251 Coon Rapids Blvd NW
- 2240 Coon Rapids Blvd NW
- 10759 Thrush St NW
- 10659 Verdin St NW
- 10665 Verdin St NW
- 2331 Coon Rapids Blvd NW
- 10623 Verdin St NW
- 2241 Coon Rapids Blvd NW