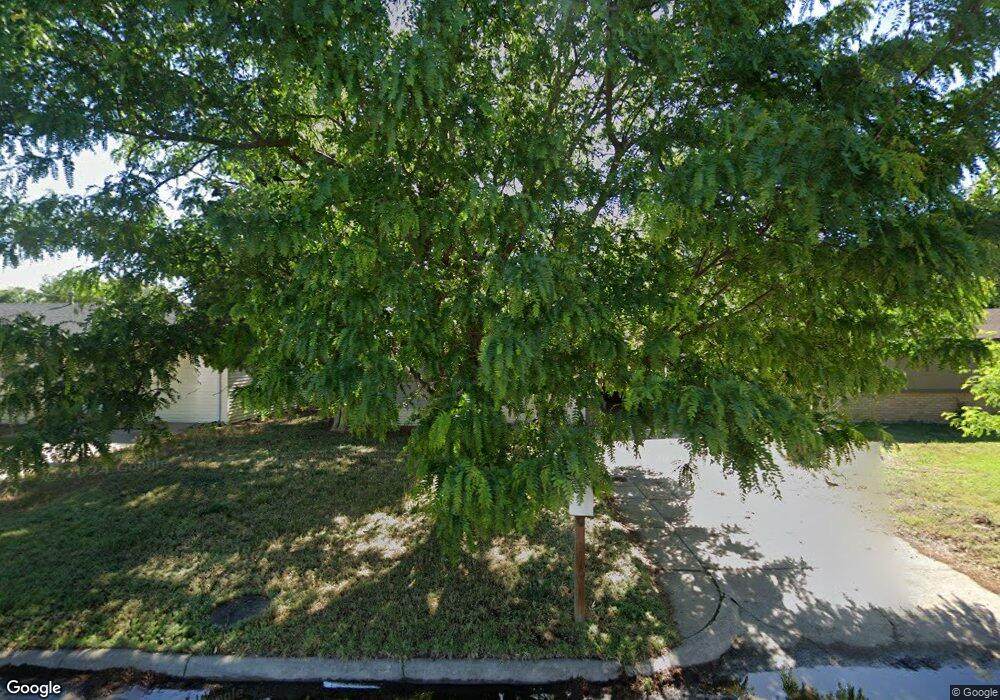
2320 N 7th St Garden City, KS 67846
Estimated Value: $150,000 - $166,640
2
Beds
1
Bath
744
Sq Ft
$216/Sq Ft
Est. Value
About This Home
This home is located at 2320 N 7th St, Garden City, KS 67846 and is currently estimated at $160,410, approximately $215 per square foot. 2320 N 7th St is a home located in Finney County with nearby schools including Georgia Matthews Elementary School, Bernadine Sitts Intermediate Center, and Horace J. Good Middle School.
Ownership History
Date
Name
Owned For
Owner Type
Purchase Details
Closed on
Mar 15, 2011
Sold by
Federal Home Loan Mortgage Corporation
Bought by
Pahls Edwin T
Current Estimated Value
Home Financials for this Owner
Home Financials are based on the most recent Mortgage that was taken out on this home.
Original Mortgage
$32,250
Outstanding Balance
$22,356
Interest Rate
4.98%
Mortgage Type
Commercial
Estimated Equity
$138,054
Purchase Details
Closed on
Nov 4, 2010
Sold by
Guerrero Erick A and Guerrero Maritza B
Bought by
Federal Home Loan Mortgage Corporation
Purchase Details
Closed on
Aug 13, 2007
Sold by
Scott Steven J and Scott Stacey L
Bought by
Guerrero Erick A and Guerrero Maritza B
Home Financials for this Owner
Home Financials are based on the most recent Mortgage that was taken out on this home.
Original Mortgage
$53,400
Interest Rate
6.7%
Mortgage Type
New Conventional
Create a Home Valuation Report for This Property
The Home Valuation Report is an in-depth analysis detailing your home's value as well as a comparison with similar homes in the area
Home Values in the Area
Average Home Value in this Area
Purchase History
| Date | Buyer | Sale Price | Title Company |
|---|---|---|---|
| Pahls Edwin T | $45,100 | Chicago Title | |
| Federal Home Loan Mortgage Corporation | $57,683 | None Available | |
| Guerrero Erick A | -- | None Available |
Source: Public Records
Mortgage History
| Date | Status | Borrower | Loan Amount |
|---|---|---|---|
| Open | Pahls Edwin T | $32,250 | |
| Previous Owner | Guerrero Erick A | $53,400 |
Source: Public Records
Tax History Compared to Growth
Tax History
| Year | Tax Paid | Tax Assessment Tax Assessment Total Assessment is a certain percentage of the fair market value that is determined by local assessors to be the total taxable value of land and additions on the property. | Land | Improvement |
|---|---|---|---|---|
| 2024 | $2,640 | $16,694 | $1,812 | $14,882 |
| 2023 | $2,640 | $16,124 | $1,507 | $14,617 |
| 2022 | $2,112 | $13,352 | $1,372 | $11,980 |
| 2021 | $1,967 | $12,177 | $1,372 | $10,805 |
| 2020 | $1,786 | $11,276 | $787 | $10,489 |
| 2019 | $1,517 | $9,796 | $787 | $9,009 |
| 2018 | $1,465 | $9,513 | $787 | $8,726 |
| 2017 | $1,295 | $0 | $0 | $0 |
| 2016 | $1,141 | $0 | $0 | $0 |
| 2015 | $1,158 | $0 | $0 | $0 |
| 2012 | -- | $0 | $0 | $0 |
Source: Public Records
Map
Nearby Homes
- 2303 N 3rd St
- 2601 N Main St
- 2614 N 7th St
- 624 Briar Hill Dr
- 2018 N 6th St
- 2002 A St
- 701 E Fair St
- 807 E Price St
- 1809 N Main St
- 1705 N 6th St
- 1101 E Mary St
- 2010 N Belmont Place
- 2106 N Belmont Place Unit 4
- 1709 Parkwood Ln
- 2505 N Carriage Ln
- 1706 Hattie St
- 2004 N 10th St
- 2504 N Carriage Ln
- 2617 N Coachman Ln
- 1409 N Main St