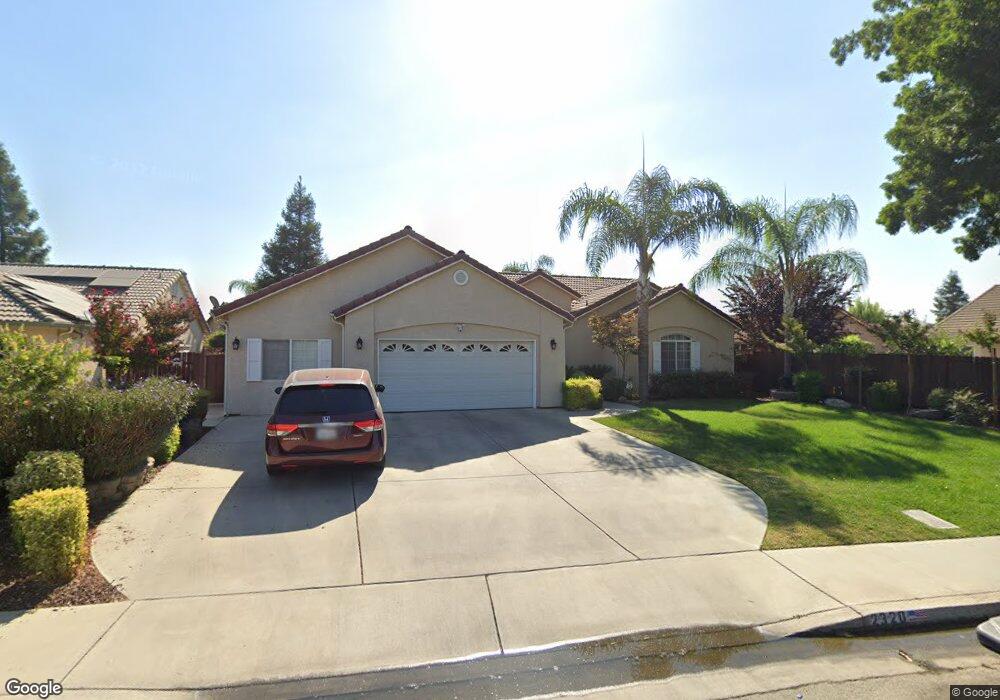
2320 N Zachary St Visalia, CA 93291
Northwest Visalia NeighborhoodEstimated Value: $442,111 - $470,000
4
Beds
2
Baths
1,892
Sq Ft
$243/Sq Ft
Est. Value
About This Home
This home is located at 2320 N Zachary St, Visalia, CA 93291 and is currently estimated at $460,278, approximately $243 per square foot. 2320 N Zachary St is a home located in Tulare County with nearby schools including Riverway Elementary School, Valley Oak Middle School, and Golden West High School.
Ownership History
Date
Name
Owned For
Owner Type
Purchase Details
Closed on
May 14, 2015
Sold by
Barraza Patricia
Bought by
Loera Victor and Barraza Patricia
Current Estimated Value
Purchase Details
Closed on
Apr 28, 2015
Sold by
Ramos Fernando
Bought by
Barraza Patricia
Purchase Details
Closed on
Apr 22, 2015
Sold by
Barraza Patricia
Bought by
Ramos Fernando
Purchase Details
Closed on
Oct 15, 2014
Sold by
Barraza Paula Esther
Bought by
Barraza Paula and Salvador & Paula Barraza Revocable Trust
Purchase Details
Closed on
Apr 12, 2004
Sold by
Ramos Jesus M
Bought by
Ramos Paula E
Purchase Details
Closed on
Feb 11, 2004
Sold by
Smee Builders Inc
Bought by
Ramos Paula E
Home Financials for this Owner
Home Financials are based on the most recent Mortgage that was taken out on this home.
Original Mortgage
$197,590
Interest Rate
5.39%
Mortgage Type
Purchase Money Mortgage
Create a Home Valuation Report for This Property
The Home Valuation Report is an in-depth analysis detailing your home's value as well as a comparison with similar homes in the area
Home Values in the Area
Average Home Value in this Area
Purchase History
| Date | Buyer | Sale Price | Title Company |
|---|---|---|---|
| Loera Victor | -- | None Available | |
| Barraza Patricia | -- | None Available | |
| Ramos Fernando | -- | None Available | |
| Barraza Paula | -- | None Available | |
| Ramos Paula E | -- | First American Title Co | |
| Ramos Paula E | $208,000 | First American Title Co |
Source: Public Records
Mortgage History
| Date | Status | Borrower | Loan Amount |
|---|---|---|---|
| Previous Owner | Ramos Paula E | $197,590 |
Source: Public Records
Tax History Compared to Growth
Tax History
| Year | Tax Paid | Tax Assessment Tax Assessment Total Assessment is a certain percentage of the fair market value that is determined by local assessors to be the total taxable value of land and additions on the property. | Land | Improvement |
|---|---|---|---|---|
| 2025 | $3,959 | $352,342 | $63,979 | $288,363 |
| 2024 | $3,959 | $345,434 | $62,725 | $282,709 |
| 2023 | $3,857 | $338,662 | $61,496 | $277,166 |
| 2022 | $3,696 | $332,023 | $60,291 | $271,732 |
| 2021 | $3,642 | $320,000 | $80,000 | $240,000 |
| 2020 | $3,327 | $289,000 | $72,000 | $217,000 |
| 2019 | $3,175 | $279,000 | $70,000 | $209,000 |
| 2018 | $2,998 | $265,000 | $66,000 | $199,000 |
| 2017 | $2,830 | $249,000 | $62,000 | $187,000 |
| 2016 | $2,821 | $233,000 | $58,000 | $175,000 |
| 2015 | $2,211 | $213,000 | $53,000 | $160,000 |
| 2014 | $2,211 | $199,000 | $50,000 | $149,000 |
Source: Public Records
Map
Nearby Homes
- 5035 W Sunnyview Ct Unit Syc57
- 2108 N Woodland St
- 2025 W Crystal Ave
- 3137 W Delaware Ct
- 3010 W Ceres Ave
- 3103 W Wren Ave
- 2667 W Payson Ave
- 2336 N University St
- 7300 Woodbine Ave
- 1911 W Vine Ave
- 1722 N Mooney Blvd
- 1933 W Buena Vista Ave
- 1625 W Sunnyview Ave
- 2326 W Flagstaff Ct
- 3024 W Elowin Ave
- 2805 W Brooke Ave
- 2015 N Hall Ct
- 3542 W Oakridge Ave
- 2851 W Sedona Ave
- 3005 N Dayton St
- 2332 N Zachary St
- 2506 W Sunnyview Ave
- 2524 W Sunnyview Ave
- 2335 N Sallee Ct Lot #31
- 2335 N Sallee Ct
- 2448 W Sunnyview Ave
- 2448 W Sunnyview Ave Unit 141
- 2603 W Oakridge Ave
- 2338 N Zachary St
- 2343 N Sallee Ct
- 2440 W Sunnyview Ave Unit 142
- 2331 N Sallee Ct
- 2606 W Sunnyview Ct
- 2600 W Oakridge Ave
- 2401 N Sallee Ct
- 2434 W Sunnyview Ave
- 2434 W Sunnyview Ave Unit 143
- 2615 W Oakridge Ave
- 2604 W Oakridge Ave
- 2515 W Sunnyview Ave