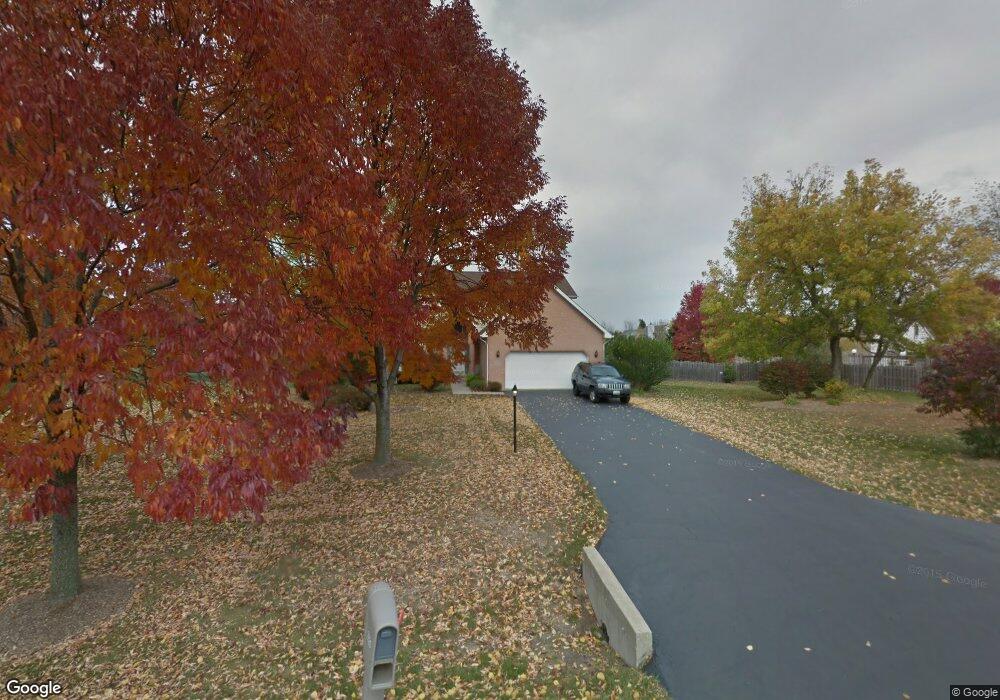
2320 S Hidden Trail Spring Grove, IL 60081
Estimated Value: $417,000 - $461,000
4
Beds
3
Baths
2,358
Sq Ft
$186/Sq Ft
Est. Value
About This Home
This home is located at 2320 S Hidden Trail, Spring Grove, IL 60081 and is currently estimated at $437,928, approximately $185 per square foot. 2320 S Hidden Trail is a home located in McHenry County with nearby schools including Spring Grove Elementary School, Nippersink Middle School, and Richmond-Burton High School.
Ownership History
Date
Name
Owned For
Owner Type
Purchase Details
Closed on
Mar 20, 2017
Sold by
Platek Bonnie J
Bought by
Markko Luke R
Current Estimated Value
Home Financials for this Owner
Home Financials are based on the most recent Mortgage that was taken out on this home.
Original Mortgage
$213,750
Outstanding Balance
$177,253
Interest Rate
4.17%
Mortgage Type
New Conventional
Estimated Equity
$260,675
Purchase Details
Closed on
Mar 5, 2008
Sold by
Platek James W
Bought by
Platek Bonnie J
Purchase Details
Closed on
Aug 16, 1999
Sold by
Lyon Roger M and Lyon Rosemary
Bought by
Platek James W and Platek Bonnie J
Home Financials for this Owner
Home Financials are based on the most recent Mortgage that was taken out on this home.
Original Mortgage
$172,800
Interest Rate
7.77%
Purchase Details
Closed on
Dec 30, 1993
Sold by
Parkway Bank & Trust Company
Bought by
Lyon Roger M and Lyon Rosemary
Home Financials for this Owner
Home Financials are based on the most recent Mortgage that was taken out on this home.
Original Mortgage
$156,000
Interest Rate
7.35%
Create a Home Valuation Report for This Property
The Home Valuation Report is an in-depth analysis detailing your home's value as well as a comparison with similar homes in the area
Home Values in the Area
Average Home Value in this Area
Purchase History
| Date | Buyer | Sale Price | Title Company |
|---|---|---|---|
| Markko Luke R | $225,000 | Fidelity National Title | |
| Platek Bonnie J | -- | None Available | |
| Platek James W | $216,000 | -- | |
| Lyon Roger M | $196,000 | -- |
Source: Public Records
Mortgage History
| Date | Status | Borrower | Loan Amount |
|---|---|---|---|
| Open | Markko Luke R | $213,750 | |
| Previous Owner | Platek James W | $172,800 | |
| Previous Owner | Lyon Roger M | $156,000 |
Source: Public Records
Tax History Compared to Growth
Tax History
| Year | Tax Paid | Tax Assessment Tax Assessment Total Assessment is a certain percentage of the fair market value that is determined by local assessors to be the total taxable value of land and additions on the property. | Land | Improvement |
|---|---|---|---|---|
| 2024 | $8,711 | $121,895 | $24,484 | $97,411 |
| 2023 | $8,459 | $111,431 | $22,382 | $89,049 |
| 2022 | $8,171 | $100,334 | $20,153 | $80,181 |
| 2021 | $7,439 | $90,930 | $19,343 | $71,587 |
| 2020 | $7,319 | $87,492 | $18,612 | $68,880 |
| 2019 | $7,232 | $84,681 | $18,014 | $66,667 |
| 2018 | $7,540 | $83,738 | $17,270 | $66,468 |
| 2017 | $7,537 | $79,743 | $16,446 | $63,297 |
| 2016 | $7,416 | $74,764 | $15,419 | $59,345 |
| 2013 | -- | $68,018 | $14,579 | $53,439 |
Source: Public Records
Map
Nearby Homes
- 8720 Galleria Ct
- 9436 Bellaire Ln
- 8207 Squirrel Dr
- 2214 Main Street Rd
- 1914 Spring Dale Dr
- 10201 Fox Bluff Ln
- Lot 65 & 66 Main Street Rd
- 2150 U S 12
- 8789 Bentley Ln
- LOT 9 Mayo Ct
- 7416 Briar Ct
- 2303 Fox Bluff Ln
- 1992 Red Oak Ln
- 3013 N Us Highway 12
- Lot 61 Beverly Way
- Lot 57 Beverly Way
- Lot 59 Beverly Way
- Lot 64 Beverly Way
- Lot 60 Beverly Way
- Lot 58 Beverly Way
- 2402 S Hidden Trail
- 2312 N Hidden Trail
- 8815 Hidden Trail
- 2408 S Hidden Trail
- 2311 Pine Crest Ct
- 2319 S Hidden Trail
- 2317 Pine Crest Ct
- 2313 S Hidden Trail
- 2403 Pine Crest Ct
- 2405 S Hidden Trail
- 2303 S Hidden Trail
- 8909 Hidden Trail
- 2409 Pine Crest Ct
- 2307 S Hidden Trail
- 8814 Hidden Trail
- 2415 Pine Crest Ct
- 2314 Amanda Dr
- 2320 Amanda Dr
- 8819 Hidden Trail