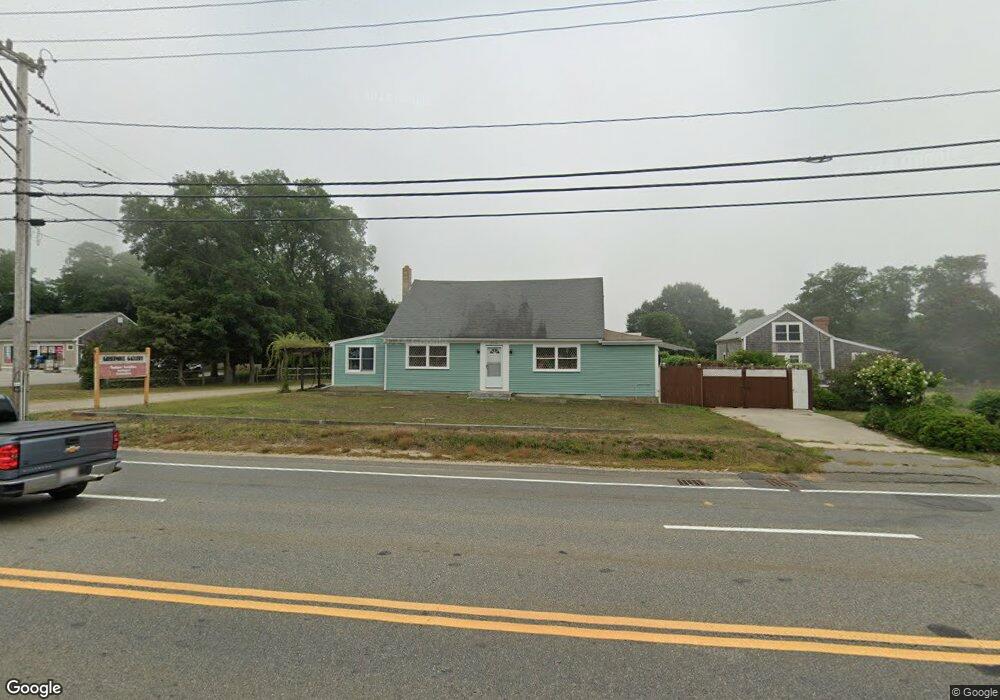
2320 State Hwy Eastham, MA 02642
Estimated Value: $713,745
3
Beds
2
Baths
4,600
Sq Ft
$155/Sq Ft
Est. Value
About This Home
This home is located at 2320 State Hwy, Eastham, MA 02642 and is currently estimated at $713,745, approximately $155 per square foot. 2320 State Hwy is a home located in Barnstable County with nearby schools including Eastham Elementary School, Nauset Regional Middle School, and Nauset Regional High School.
Ownership History
Date
Name
Owned For
Owner Type
Purchase Details
Closed on
Sep 5, 2014
Sold by
South Coast Real Est H
Bought by
Guo Gretchen J
Current Estimated Value
Home Financials for this Owner
Home Financials are based on the most recent Mortgage that was taken out on this home.
Original Mortgage
$250,000
Outstanding Balance
$191,250
Interest Rate
4.12%
Mortgage Type
Commercial
Estimated Equity
$522,495
Purchase Details
Closed on
Apr 2, 2014
Sold by
Panaccione Lisa and First Citizens Fcu
Bought by
South Coast Re Holding
Purchase Details
Closed on
Apr 12, 1999
Sold by
Gristmill Rt and Nickerson Nathan A
Bought by
Panaccione Michael and Panaccione Lisa
Home Financials for this Owner
Home Financials are based on the most recent Mortgage that was taken out on this home.
Original Mortgage
$144,600
Interest Rate
6.83%
Mortgage Type
Commercial
Purchase Details
Closed on
Jan 9, 1996
Sold by
Usa Sba
Bought by
Gristmill Rt and Nickerson Nathan A
Create a Home Valuation Report for This Property
The Home Valuation Report is an in-depth analysis detailing your home's value as well as a comparison with similar homes in the area
Home Values in the Area
Average Home Value in this Area
Purchase History
| Date | Buyer | Sale Price | Title Company |
|---|---|---|---|
| Guo Gretchen J | $320,000 | -- | |
| South Coast Re Holding | $272,000 | -- | |
| Panaccione Michael | $146,600 | -- | |
| Gristmill Rt | $30,000 | -- |
Source: Public Records
Mortgage History
| Date | Status | Borrower | Loan Amount |
|---|---|---|---|
| Open | Guo Gretchen J | $250,000 | |
| Previous Owner | Gristmill Rt | $187,500 | |
| Previous Owner | Gristmill Rt | $30,000 | |
| Previous Owner | Gristmill Rt | $144,600 |
Source: Public Records
Tax History Compared to Growth
Tax History
| Year | Tax Paid | Tax Assessment Tax Assessment Total Assessment is a certain percentage of the fair market value that is determined by local assessors to be the total taxable value of land and additions on the property. | Land | Improvement |
|---|---|---|---|---|
| 2025 | $3,059 | $396,800 | $174,600 | $222,200 |
| 2024 | $2,748 | $392,000 | $169,500 | $222,500 |
| 2023 | $2,788 | $385,100 | $164,600 | $220,500 |
| 2022 | $2,986 | $348,000 | $146,900 | $201,100 |
| 2021 | $3,135 | $341,500 | $142,600 | $198,900 |
| 2020 | $3,106 | $356,200 | $145,600 | $210,600 |
| 2019 | $2,916 | $353,500 | $145,600 | $207,900 |
| 2018 | $2,744 | $328,600 | $141,300 | $187,300 |
| 2017 | $2,658 | $336,500 | $139,000 | $197,500 |
| 2016 | $2,491 | $334,800 | $138,100 | $196,700 |
| 2015 | $2,374 | $334,300 | $136,700 | $197,600 |
Source: Public Records
Map
Nearby Homes
- 1975 State Hwy Unit 3
- 1975 State Hwy Unit 5
- 1875 State Hwy
- 180 Country Ln
- 645 Samoset Rd
- 20 Redberry Ln
- 4 Wood Duck Ln
- 10 Surrey Dr
- 330 Hay Rd
- 70 Deerfield Ln
- 10 Alston Ct
- 60 Smith Heights Way
- 45 Starlight Ln
- 65 Cestaro Way
- 30 Cove Rd
- 1061 State Hwy Unit 4
- 25 Twin Rocks Dr
- 993 Intonti Way
- 995 Intonti Way
- 785 State Hwy Unit 9
- 2300 State Hwy
- 20 Christian Creek Ln
- 25 Christian Creek Ln
- 2355 State Hwy
- 1 Rabbit Run
- 2360 State Hwy
- 2365 State Hwy
- 2390 State Hwy
- 35 Van Dale Rd
- 25 Van Dale Ave
- 3 Rabbit Run
- 2265 State Hwy
- 35 Christian Creek Ln
- 35 Van Dale Ave
- 2255 State Hwy
- 2375 State Hwy
- 40 Van Dale Ave
- 2275 State Hwy
- 2420 State Hwy
- 2425 State Hwy