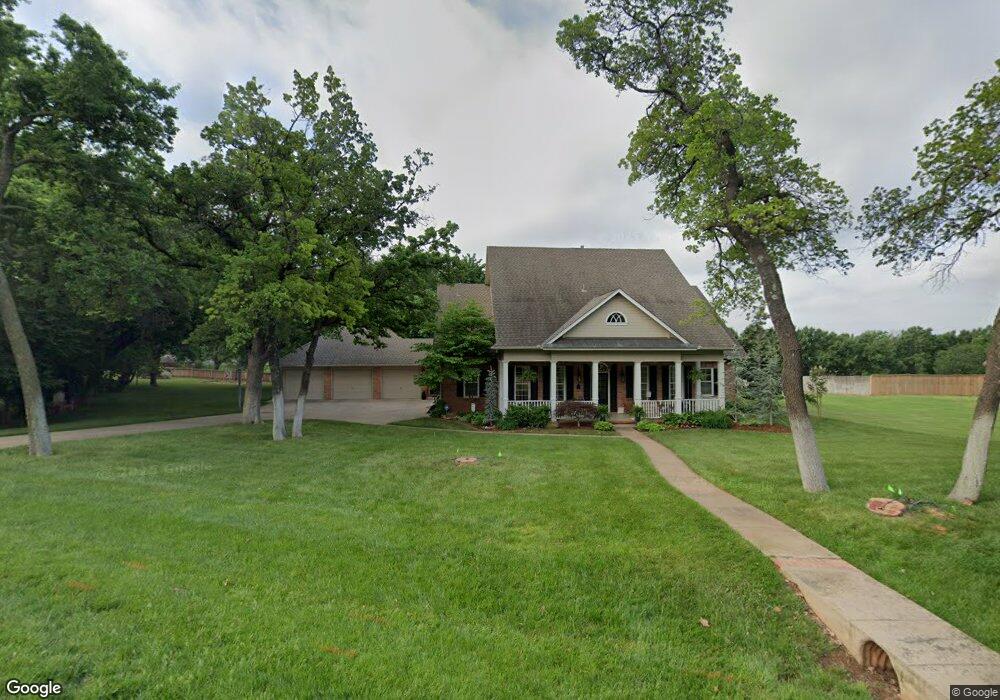
23200 Running Deer Trail Edmond, OK 73025
North Edmond NeighborhoodEstimated Value: $632,704 - $703,000
4
Beds
3
Baths
3,669
Sq Ft
$180/Sq Ft
Est. Value
About This Home
This home is located at 23200 Running Deer Trail, Edmond, OK 73025 and is currently estimated at $661,176, approximately $180 per square foot. 23200 Running Deer Trail is a home located in Oklahoma County with nearby schools including Prairie Vale Elementary School, Deer Creek Middle School, and Deer Creek Intermediate School.
Ownership History
Date
Name
Owned For
Owner Type
Purchase Details
Closed on
Jun 23, 2009
Sold by
Klock Roger R and Roger R Klock 2004 Trust
Bought by
Hayes Robert W and Hayes Shawna D
Current Estimated Value
Home Financials for this Owner
Home Financials are based on the most recent Mortgage that was taken out on this home.
Original Mortgage
$280,000
Outstanding Balance
$178,808
Interest Rate
4.97%
Mortgage Type
Purchase Money Mortgage
Estimated Equity
$482,368
Purchase Details
Closed on
Sep 18, 2004
Sold by
Klock Roger R and Klock Dixie L
Bought by
Klock Roger R and Klock Dixie L
Purchase Details
Closed on
Jan 15, 1999
Sold by
Hance Edwin E and Hance Carolyn K
Bought by
Klock Roger R and Klock Dixie L
Purchase Details
Closed on
Sep 26, 1997
Sold by
Cormier Ronald Joseph and Cormier Beverly Ann
Bought by
Hance Edwin E and Hance Carolyn K
Create a Home Valuation Report for This Property
The Home Valuation Report is an in-depth analysis detailing your home's value as well as a comparison with similar homes in the area
Home Values in the Area
Average Home Value in this Area
Purchase History
| Date | Buyer | Sale Price | Title Company |
|---|---|---|---|
| Hayes Robert W | $370,000 | Stewart Abstract & Title Of | |
| Klock Roger R | -- | -- | |
| Klock Roger R | $305,000 | -- | |
| Hance Edwin E | $307,000 | -- |
Source: Public Records
Mortgage History
| Date | Status | Borrower | Loan Amount |
|---|---|---|---|
| Open | Hayes Robert W | $280,000 |
Source: Public Records
Tax History Compared to Growth
Tax History
| Year | Tax Paid | Tax Assessment Tax Assessment Total Assessment is a certain percentage of the fair market value that is determined by local assessors to be the total taxable value of land and additions on the property. | Land | Improvement |
|---|---|---|---|---|
| 2024 | $6,203 | $52,467 | $8,005 | $44,462 |
| 2023 | $6,203 | $50,938 | $8,137 | $42,801 |
| 2022 | $5,563 | $49,455 | $9,485 | $39,970 |
| 2021 | $5,308 | $48,015 | $10,095 | $37,920 |
| 2020 | $5,732 | $46,962 | $10,081 | $36,881 |
| 2019 | $333 | $45,595 | $10,095 | $35,500 |
| 2018 | $351 | $48,125 | $0 | $0 |
| 2017 | $345 | $47,268 | $9,781 | $37,487 |
| 2016 | $5,645 | $45,891 | $8,766 | $37,125 |
| 2015 | $5,024 | $44,554 | $8,833 | $35,721 |
| 2014 | $4,926 | $43,256 | $9,076 | $34,180 |
Source: Public Records
Map
Nearby Homes
- 13745 Limestone Ln
- 9585 Blue Bonnet Blvd
- 1180 Bailey Cir
- 2404 Rambling Rd
- 2501 Tall Oaks Trail
- 4975 N Santa fe Ave
- 2320 W Sorghum Mill Rd
- 6101 N Santa fe Ave
- 2109 Wiregrass Dr
- 5901 Calcutta Ln
- 6201 Canopy Ln
- 1833 Red Prairie Dr
- 4001 Creekwood
- 2108 Woodhill Rd
- 2009 Colonial Way
- 14142 Fox Lair Ln
- 10071 Lacewood Dr
- 1720 Silver Oaks Dr
- 1601 Irvine Dr
- 22622 Graces Terrace
- 23160 Running Deer Trail
- 23220 Running Deer Trail
- 23100 Lauren Ln
- 23251 Running Deer Trail
- 23130 Lauren Ln
- 23261 Hunters Trail
- 23120 Running Deer Trail
- 23060 Lauren Ln
- 23311 Running Deer Trail
- 23281 Hunters Trail
- 23380 Hunters Spring Dr
- 23121 Running Deer Trail
- 23240 Hunters Trail
- 23415 Hunters Trail
- 23250 Hunters Spring Dr
- 23040 Lauren Ln
- 23250 Lauren Ln
- 23260 Hunters Trail
- 23081 Lauren Ln
- 23141 Lauren Ln