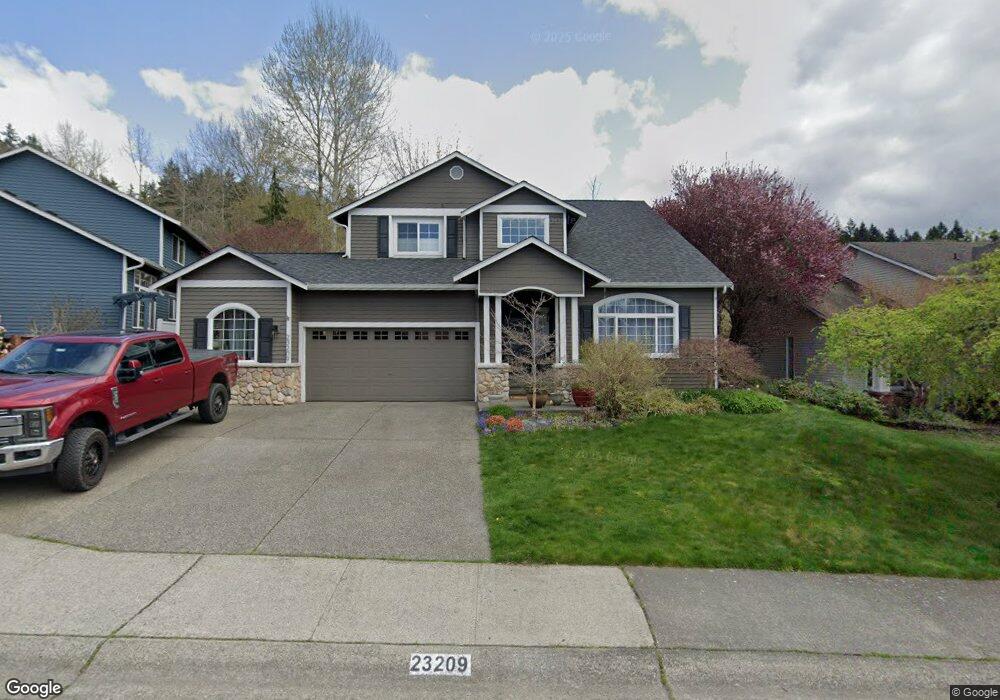
23209 9th Place W Bothell, WA 98021
Queensborough-Brentwood NeighborhoodEstimated Value: $1,062,164 - $1,165,000
3
Beds
3
Baths
2,144
Sq Ft
$514/Sq Ft
Est. Value
About This Home
This home is located at 23209 9th Place W, Bothell, WA 98021 and is currently estimated at $1,101,541, approximately $513 per square foot. 23209 9th Place W is a home located in Snohomish County with nearby schools including Lockwood Elementary School, Kenmore Middle School, and Bothell High School.
Ownership History
Date
Name
Owned For
Owner Type
Purchase Details
Closed on
Sep 23, 2005
Sold by
Griffin Rick L and Griffin Jodi L
Bought by
Scotchler Christopher D and Scotchler Kelly J
Current Estimated Value
Home Financials for this Owner
Home Financials are based on the most recent Mortgage that was taken out on this home.
Original Mortgage
$69,600
Outstanding Balance
$35,776
Interest Rate
5.72%
Mortgage Type
Credit Line Revolving
Estimated Equity
$1,065,765
Purchase Details
Closed on
Aug 13, 1998
Sold by
Wagner Richard E and Wagner Esther L
Bought by
Griffin Rick L and Griffin Jodi L
Home Financials for this Owner
Home Financials are based on the most recent Mortgage that was taken out on this home.
Original Mortgage
$191,100
Interest Rate
6.88%
Create a Home Valuation Report for This Property
The Home Valuation Report is an in-depth analysis detailing your home's value as well as a comparison with similar homes in the area
Home Values in the Area
Average Home Value in this Area
Purchase History
| Date | Buyer | Sale Price | Title Company |
|---|---|---|---|
| Scotchler Christopher D | $464,000 | Commonwealth Land Title | |
| Griffin Rick L | $238,907 | Chicago Title Insurance Co |
Source: Public Records
Mortgage History
| Date | Status | Borrower | Loan Amount |
|---|---|---|---|
| Open | Scotchler Christopher D | $69,600 | |
| Open | Scotchler Christopher D | $371,200 | |
| Previous Owner | Griffin Rick L | $191,100 |
Source: Public Records
Tax History
| Year | Tax Paid | Tax Assessment Tax Assessment Total Assessment is a certain percentage of the fair market value that is determined by local assessors to be the total taxable value of land and additions on the property. | Land | Improvement |
|---|---|---|---|---|
| 2026 | $7,826 | $1,137,400 | $772,700 | $364,700 |
| 2025 | $7,711 | $922,900 | $572,400 | $350,500 |
| 2024 | $7,711 | $916,100 | $577,700 | $338,400 |
| 2023 | $8,129 | $1,052,400 | $661,500 | $390,900 |
| 2022 | $7,491 | $776,000 | $444,200 | $331,800 |
| 2020 | $6,575 | $633,000 | $321,000 | $312,000 |
| 2019 | $5,872 | $578,800 | $270,000 | $308,800 |
| 2018 | $5,495 | $510,500 | $235,000 | $275,500 |
| 2017 | $4,656 | $443,800 | $185,000 | $258,800 |
| 2016 | $4,527 | $418,000 | $170,000 | $248,000 |
| 2015 | $4,593 | $399,500 | $155,000 | $244,500 |
| 2013 | $4,226 | $319,300 | $129,000 | $190,300 |
Source: Public Records
Map
Nearby Homes
- 714 228th St SW Unit O101
- 931 236th Place SW
- 1017 236th Place SW
- 23716 9th Place W
- 1313 228th Place SW
- 404 228th St SW Unit E101
- 23812 Lake Dr E
- 23728 Vista View Ave
- 23619 5th Ave W
- 22619 4th Ave W Unit 3-103
- 18 232nd Place SW
- 24114 7th Place W
- 1121 244th St SW Unit 66
- 17 232nd Place SE
- 24123 7th Ave W
- 22827 Meridian Ave S
- 23716 Locust Way
- 22827 20th Place W
- 23520 20th Ave W
- 23518 20th Ave W
- 912 232nd St SW
- 23215 9th Place W
- 906 232nd St SW
- 23221 9th Place W
- 23210 9th Place W
- 23210 9th Place W Unit LOT3
- 23204 9th Place W
- 913 232nd St SW
- 23216 9th Place W
- 23226 8th Place W
- 23130 9th Place W
- 23227 9th Place W
- 909 232nd St SW
- 905 232nd St SW
- 23224 9th Place W
- 23224 8th Place W
- 909 232nd St SW
- 23129 9th Place W
- 23228 8th Place W
- 23124 9th Place W
Your Personal Tour Guide
Ask me questions while you tour the home.