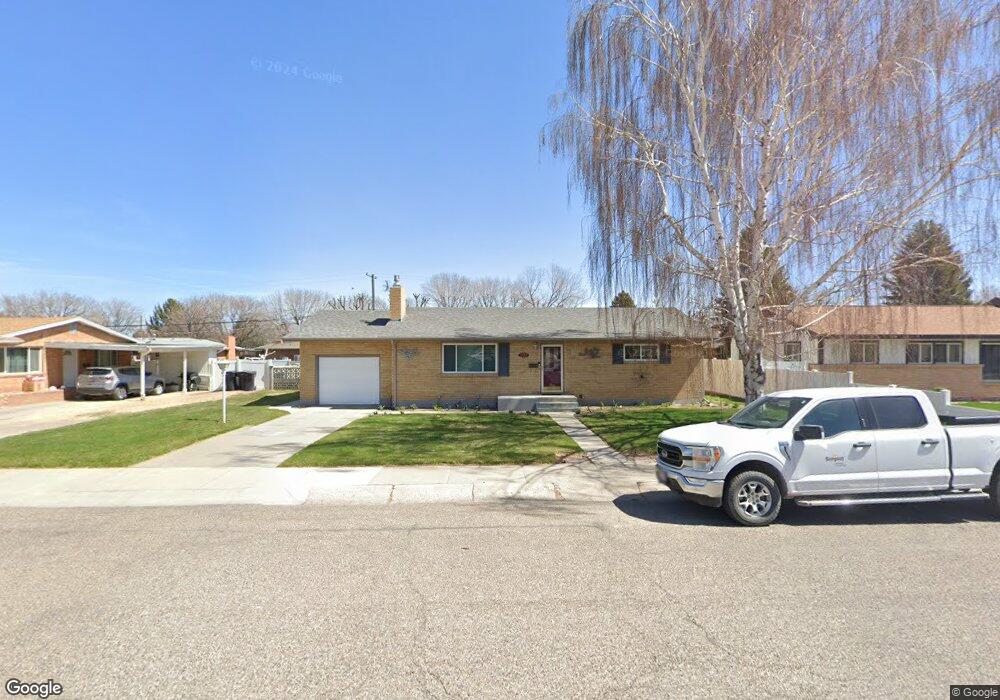
2321 Burton Ave Burley, ID 83318
Estimated Value: $298,000 - $346,000
3
Beds
3
Baths
2,168
Sq Ft
$149/Sq Ft
Est. Value
About This Home
This home is located at 2321 Burton Ave, Burley, ID 83318 and is currently estimated at $323,200, approximately $149 per square foot. 2321 Burton Ave is a home located in Cassia County with nearby schools including Mountain View Elementary School, White Pine Elementary School, and Burley Junior High School.
Ownership History
Date
Name
Owned For
Owner Type
Purchase Details
Closed on
Feb 15, 2023
Sold by
Permann Austin and Permann Kara
Bought by
Permann Austin and Permann Kara
Current Estimated Value
Home Financials for this Owner
Home Financials are based on the most recent Mortgage that was taken out on this home.
Original Mortgage
$49,900
Outstanding Balance
$48,376
Interest Rate
6.48%
Mortgage Type
Credit Line Revolving
Estimated Equity
$274,824
Purchase Details
Closed on
Jan 31, 2022
Sold by
Austin Permann
Bought by
Permann Austin and Perman Kara
Purchase Details
Closed on
Feb 23, 2021
Sold by
Black Dan A
Bought by
Permann Austin K and Polatis Kara
Home Financials for this Owner
Home Financials are based on the most recent Mortgage that was taken out on this home.
Original Mortgage
$194,750
Interest Rate
2.7%
Mortgage Type
New Conventional
Create a Home Valuation Report for This Property
The Home Valuation Report is an in-depth analysis detailing your home's value as well as a comparison with similar homes in the area
Home Values in the Area
Average Home Value in this Area
Purchase History
| Date | Buyer | Sale Price | Title Company |
|---|---|---|---|
| Permann Austin | -- | -- | |
| Permann Austin | -- | New Title Company Name | |
| Permann Austin | -- | None Listed On Document | |
| Permann Austin K | -- | Titleone Twin Falls |
Source: Public Records
Mortgage History
| Date | Status | Borrower | Loan Amount |
|---|---|---|---|
| Open | Permann Austin | $49,900 | |
| Previous Owner | Permann Austin K | $194,750 |
Source: Public Records
Tax History Compared to Growth
Tax History
| Year | Tax Paid | Tax Assessment Tax Assessment Total Assessment is a certain percentage of the fair market value that is determined by local assessors to be the total taxable value of land and additions on the property. | Land | Improvement |
|---|---|---|---|---|
| 2024 | $808 | $252,955 | $74,950 | $178,005 |
| 2023 | $1,112 | $253,355 | $74,950 | $178,405 |
| 2022 | $1,172 | $214,003 | $59,960 | $154,043 |
| 2021 | $1,276 | $180,678 | $44,415 | $136,263 |
| 2020 | $1,114 | $142,420 | $20,034 | $122,386 |
| 2019 | $1,092 | $137,723 | $18,900 | $118,823 |
| 2017 | $1,022 | $123,850 | $16,160 | $107,690 |
| 2016 | $991 | $120,713 | $16,160 | $104,553 |
| 2015 | $970 | $117,731 | $13,178 | $104,553 |
| 2014 | $956 | $117,731 | $13,178 | $104,553 |
| 2013 | $956 | $117,731 | $13,178 | $104,553 |
Source: Public Records
Map
Nearby Homes
- 590 W 24th St
- 2435 Oakley Ave Unit Burley, ID
- 628 W 24th St
- 2140 Daven Place
- 2593 Burton Ave
- 1942 Burton Ave
- 320 E 23rd Dr
- 201 W 19th St
- 2726 Fairmont Dr
- 431 Pratt Place
- 1719 Burton Ave
- 301 E 27th St
- 1729 Yale Ave
- 2441 Dorchester Ave
- 2431 Dorchester Ave
- 600 Oxford St
- 550 Oxford St
- 2339 Bristol Ave
- 2349 Bristol Ave
- 519 Lake Cleveland St