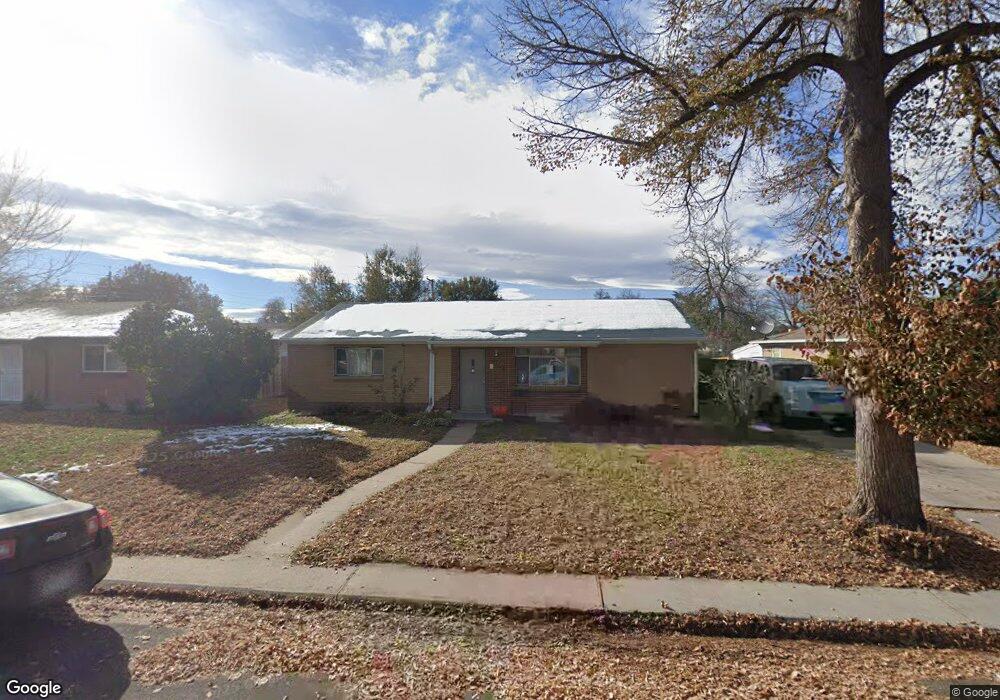
2321 Lansing St Aurora, CO 80010
North Aurora NeighborhoodEstimated Value: $391,314 - $411,000
3
Beds
1
Bath
1,144
Sq Ft
$351/Sq Ft
Est. Value
About This Home
This home is located at 2321 Lansing St, Aurora, CO 80010 and is currently estimated at $401,079, approximately $350 per square foot. 2321 Lansing St is a home located in Adams County with nearby schools including Montview Elementary School, Lincoln Elementary School, and Amargosa Creek Middle School.
Ownership History
Date
Name
Owned For
Owner Type
Purchase Details
Closed on
Dec 16, 2022
Sold by
Barbara M Rome Trust
Bought by
Minor Gabriel
Current Estimated Value
Home Financials for this Owner
Home Financials are based on the most recent Mortgage that was taken out on this home.
Original Mortgage
$382,936
Outstanding Balance
$371,445
Interest Rate
6.95%
Mortgage Type
FHA
Estimated Equity
$29,634
Purchase Details
Closed on
Jul 6, 2021
Sold by
Ronald E Rome And Barbara M Rome Trust
Bought by
The Barbar M Rome Trust
Purchase Details
Closed on
May 12, 2021
Sold by
Rome Barbara M
Bought by
Rome Barbara M and Barbara M Rome Trust
Purchase Details
Closed on
Mar 8, 2021
Sold by
Rome Barbara M
Bought by
Rome Barbara M and Barbara M Rome Trust
Purchase Details
Closed on
Sep 10, 2009
Sold by
Rome Ronald E and Rome Barbara M
Bought by
Rome Ronald E and Rome Barbara M
Purchase Details
Closed on
May 26, 2004
Sold by
Va
Bought by
Rome Ronald E and Rome Barbara M
Create a Home Valuation Report for This Property
The Home Valuation Report is an in-depth analysis detailing your home's value as well as a comparison with similar homes in the area
Home Values in the Area
Average Home Value in this Area
Purchase History
| Date | Buyer | Sale Price | Title Company |
|---|---|---|---|
| Minor Gabriel | $390,000 | Chicago Title | |
| The Barbar M Rome Trust | -- | None Available | |
| Rome Barbara M | -- | None Available | |
| Rome Barbara M | -- | None Available | |
| Rome Ronald E | -- | None Available | |
| Rome Ronald E | $38,058 | -- |
Source: Public Records
Mortgage History
| Date | Status | Borrower | Loan Amount |
|---|---|---|---|
| Open | Minor Gabriel | $382,936 |
Source: Public Records
Tax History Compared to Growth
Tax History
| Year | Tax Paid | Tax Assessment Tax Assessment Total Assessment is a certain percentage of the fair market value that is determined by local assessors to be the total taxable value of land and additions on the property. | Land | Improvement |
|---|---|---|---|---|
| 2024 | $2,483 | $25,310 | $5,000 | $20,310 |
| 2023 | $2,523 | $27,400 | $5,210 | $22,190 |
| 2022 | $2,498 | $21,980 | $5,350 | $16,630 |
| 2021 | $2,603 | $21,980 | $5,350 | $16,630 |
| 2020 | $2,696 | $22,850 | $5,510 | $17,340 |
| 2019 | $2,692 | $22,850 | $5,510 | $17,340 |
| 2018 | $1,937 | $16,370 | $4,320 | $12,050 |
| 2017 | $1,720 | $16,370 | $4,320 | $12,050 |
| 2016 | $1,321 | $12,470 | $2,390 | $10,080 |
| 2015 | $1,280 | $12,470 | $2,390 | $10,080 |
| 2014 | -- | $10,730 | $2,390 | $8,340 |
Source: Public Records
Map
Nearby Homes
- 11185 E 25th Ave
- 2391 Kingston St
- 2350 Joliet St
- 11120 E 26th Ave
- 11059 E 25th Dr
- 10950 E 26th Ave
- 2521 Moline St
- 11336 E 27th Ave
- 2045 Lima St
- 11589 E 25th Dr
- 11087 E Montview Blvd
- 11087 Montview Blvd
- 2241 Ironton St
- 2861 Lima St
- 2064 Ironton St
- 2572 Iola St
- 1967 Macon St
- 1990 Newark St
- 1902 Kenton St
- 2340 Oswego St
- 2311 Lansing St
- 2331 Lansing St
- 2301 Lansing St
- 2341 Lansing St
- 2320 Kingston St
- 2310 Kingston St
- 2330 Kingston St
- 2320 Lansing St
- 2351 Lansing St
- 2310 Lansing St
- 2330 Lansing St
- 2340 Kingston St
- 2300 Kingston St
- 2300 Lansing St
- 2340 Lansing St
- 2350 Kingston St
- 2281 Lansing St
- 2361 Lansing St
- 2361 Lansing St Unit 2
- 2361 Lansing St Unit 1