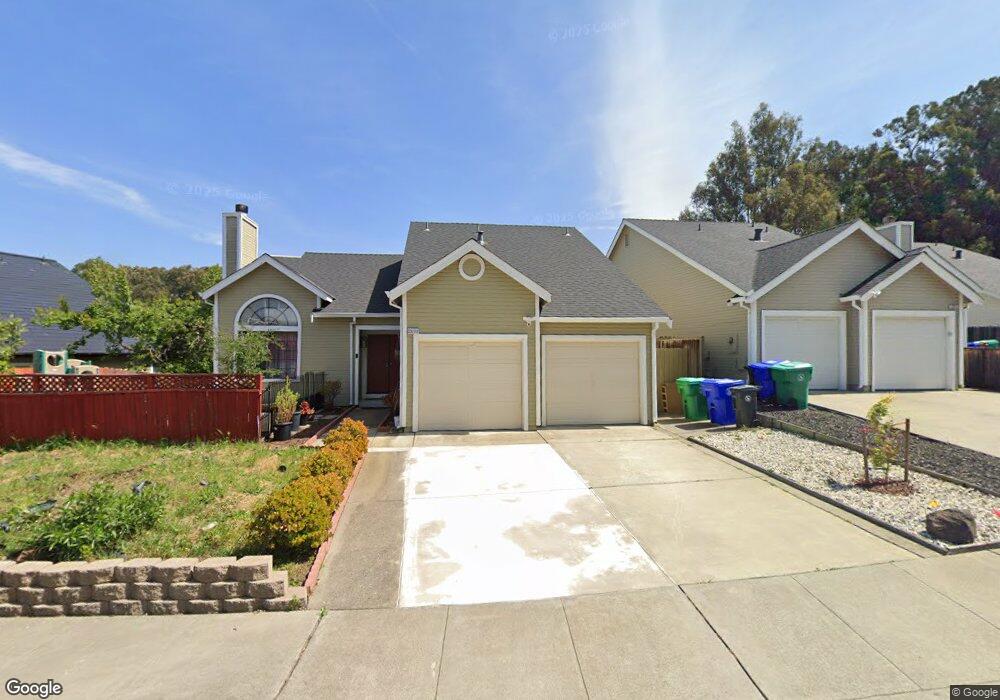
23210 Henry Ct Hayward, CA 94541
Estimated Value: $984,655 - $1,070,000
3
Beds
3
Baths
1,705
Sq Ft
$603/Sq Ft
Est. Value
About This Home
This home is located at 23210 Henry Ct, Hayward, CA 94541 and is currently estimated at $1,028,164, approximately $603 per square foot. 23210 Henry Ct is a home located in Alameda County with nearby schools including Fairview Elementary School, Bret Harte Middle School, and Hayward High School.
Ownership History
Date
Name
Owned For
Owner Type
Purchase Details
Closed on
Aug 3, 2015
Sold by
Han Jingming and Zhao Yun
Bought by
Zhao Yun
Current Estimated Value
Purchase Details
Closed on
May 9, 2011
Sold by
Zhao Qingjun
Bought by
Han Jingming
Home Financials for this Owner
Home Financials are based on the most recent Mortgage that was taken out on this home.
Original Mortgage
$245,000
Outstanding Balance
$169,950
Interest Rate
4.84%
Mortgage Type
New Conventional
Estimated Equity
$858,214
Purchase Details
Closed on
May 24, 2004
Sold by
Fan Lee Joseph J and Fan Lee Yuen
Bought by
Zerihun Mulu M
Home Financials for this Owner
Home Financials are based on the most recent Mortgage that was taken out on this home.
Original Mortgage
$412,800
Interest Rate
5.11%
Mortgage Type
Purchase Money Mortgage
Create a Home Valuation Report for This Property
The Home Valuation Report is an in-depth analysis detailing your home's value as well as a comparison with similar homes in the area
Home Values in the Area
Average Home Value in this Area
Purchase History
| Date | Buyer | Sale Price | Title Company |
|---|---|---|---|
| Zhao Yun | -- | None Available | |
| Han Jingming | -- | Old Republic Title Company | |
| Han Jingming | $355,000 | Old Republic Title Company | |
| Zerihun Mulu M | $516,000 | Fidelity National Title Co |
Source: Public Records
Mortgage History
| Date | Status | Borrower | Loan Amount |
|---|---|---|---|
| Open | Han Jingming | $245,000 | |
| Previous Owner | Zerihun Mulu M | $412,800 |
Source: Public Records
Tax History
| Year | Tax Paid | Tax Assessment Tax Assessment Total Assessment is a certain percentage of the fair market value that is determined by local assessors to be the total taxable value of land and additions on the property. | Land | Improvement |
|---|---|---|---|---|
| 2025 | $6,006 | $447,790 | $136,437 | $318,353 |
| 2024 | $6,006 | $438,875 | $133,762 | $312,113 |
| 2023 | $5,947 | $437,135 | $131,140 | $305,995 |
| 2022 | $5,808 | $421,565 | $128,569 | $299,996 |
| 2021 | $5,733 | $413,163 | $126,049 | $294,114 |
| 2020 | $5,640 | $415,857 | $124,757 | $291,100 |
| 2019 | $5,659 | $407,706 | $122,312 | $285,394 |
| 2018 | $5,315 | $399,715 | $119,914 | $279,801 |
| 2017 | $5,182 | $391,880 | $117,564 | $274,316 |
| 2016 | $4,882 | $384,198 | $115,259 | $268,939 |
| 2015 | $4,775 | $378,430 | $113,529 | $264,901 |
| 2014 | $4,544 | $371,017 | $111,305 | $259,712 |
Source: Public Records
Map
Nearby Homes
- 3280 Ohlone Way
- 3287 Kelly St
- 3606 Sarita St
- 23158 Canyon Terrace Dr
- 2851 Romagnolo St
- 25657 Crestfield Dr
- 3241 Monika Ln
- 3285 Monika Ln
- 23693 Glenbrook Ln
- 23022 Palazzo Del Kayla
- 5810 Gold Creek Dr
- 25318 Buckeye Dr
- 24785 Fairview Ave
- 2332 D St
- 0 Jensen Rd Unit 41089385
- 2847 Ralston Way
- 22490 Bayview Ave
- 2468 Hidden Ln
- 0 Hidden Oaks Dr Unit 41115723
- 2272 Kelly St
- 23218 Henry Ct
- 3351 Shawn Way
- 3357 Shawn Way
- 23226 Henry Ct
- 3363 Shawn Way
- 23216 Lori Way
- 23208 Lori Way Unit in law unit
- 23208 Lori Way
- 23224 Lori Way
- 3369 Shawn Way
- 23234 Henry Ct
- 23237 Henry Ct
- 23200 Lori Way
- 23128 Henry Ln
- 23242 Henry Ct
- 23240 Lori Way
- 3360 Shawn Way
- 23245 Henry Ct
- 23120 Henry Ln
- 23250 Henry Ct
Your Personal Tour Guide
Ask me questions while you tour the home.