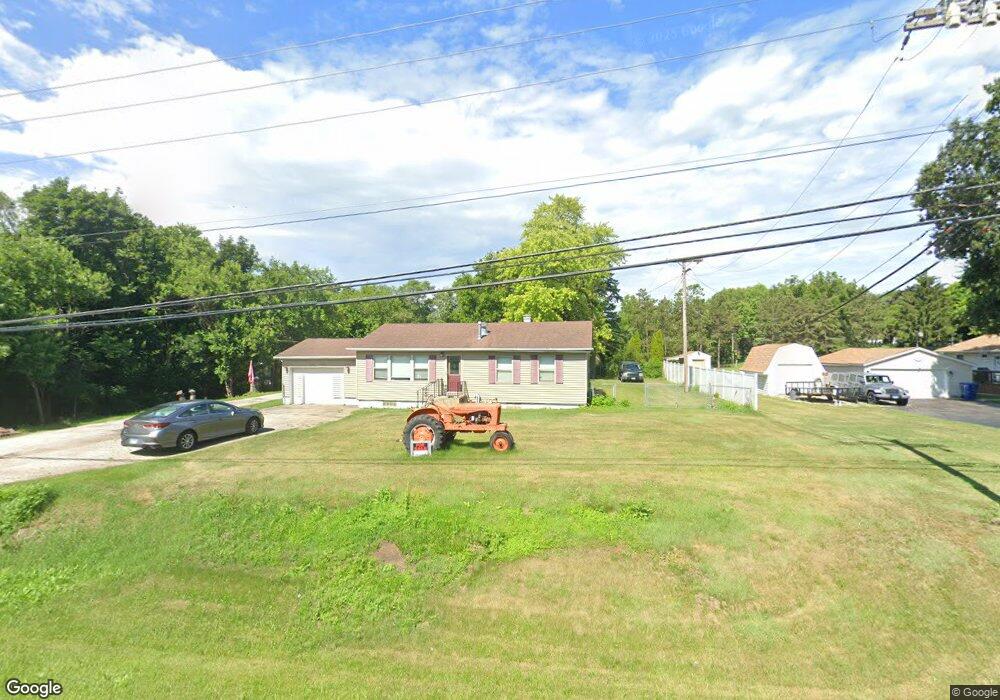
23214 S Frontage Rd W Channahon, IL 60410
Estimated Value: $193,000 - $261,000
3
Beds
--
Bath
1,005
Sq Ft
$231/Sq Ft
Est. Value
About This Home
This home is located at 23214 S Frontage Rd W, Channahon, IL 60410 and is currently estimated at $231,933, approximately $230 per square foot. 23214 S Frontage Rd W is a home located in Will County with nearby schools including N B Galloway Elementary School, Pioneer Path School, and Three Rivers School.
Ownership History
Date
Name
Owned For
Owner Type
Purchase Details
Closed on
Nov 15, 2008
Sold by
West Suburban Bank
Bought by
Medema Duane and Medema Cheryl
Current Estimated Value
Purchase Details
Closed on
Feb 28, 2005
Sold by
Gaertner Kristopher and Gaertner Corie N
Bought by
Medema Duane A and Medema Cheryl A
Home Financials for this Owner
Home Financials are based on the most recent Mortgage that was taken out on this home.
Original Mortgage
$105,200
Interest Rate
7.49%
Mortgage Type
Purchase Money Mortgage
Purchase Details
Closed on
Nov 18, 1999
Sold by
Wells Harold E and Wells Teresa K
Bought by
Gaertner Kristopher
Home Financials for this Owner
Home Financials are based on the most recent Mortgage that was taken out on this home.
Original Mortgage
$90,200
Interest Rate
7.97%
Create a Home Valuation Report for This Property
The Home Valuation Report is an in-depth analysis detailing your home's value as well as a comparison with similar homes in the area
Home Values in the Area
Average Home Value in this Area
Purchase History
| Date | Buyer | Sale Price | Title Company |
|---|---|---|---|
| Medema Duane | $11,000 | Ticor Title | |
| Medema Duane A | $131,500 | Chicago Title Insurance Co | |
| Gaertner Kristopher | $95,000 | Chicago Title Insurance Co |
Source: Public Records
Mortgage History
| Date | Status | Borrower | Loan Amount |
|---|---|---|---|
| Previous Owner | Medema Duane A | $105,200 | |
| Previous Owner | Gaertner Kristopher | $90,200 | |
| Closed | Medema Duane A | $26,300 |
Source: Public Records
Tax History Compared to Growth
Tax History
| Year | Tax Paid | Tax Assessment Tax Assessment Total Assessment is a certain percentage of the fair market value that is determined by local assessors to be the total taxable value of land and additions on the property. | Land | Improvement |
|---|---|---|---|---|
| 2024 | $2,862 | $66,478 | $16,308 | $50,170 |
| 2023 | $2,862 | $58,700 | $14,395 | $44,305 |
| 2022 | $3,694 | $52,319 | $13,490 | $38,829 |
| 2021 | $3,292 | $47,692 | $12,739 | $34,953 |
| 2020 | $3,170 | $46,666 | $12,465 | $34,201 |
| 2019 | $2,998 | $44,550 | $11,900 | $32,650 |
| 2018 | $2,864 | $42,725 | $10,977 | $31,748 |
| 2017 | $2,789 | $40,963 | $10,524 | $30,439 |
| 2016 | $2,690 | $39,312 | $10,100 | $29,212 |
| 2015 | $2,466 | $37,600 | $9,100 | $28,500 |
| 2014 | $2,466 | $37,200 | $9,100 | $28,100 |
| 2013 | $2,466 | $37,200 | $9,100 | $28,100 |
Source: Public Records
Map
Nearby Homes
- 23040 S Patricia Ln
- 22825 S Patricia Ln
- 22538 S Remington Dr
- 22456 S Lakepoint Ct
- 23722 Lakepoint Dr
- 24349 W Camelot Rd
- 22140 SW Frontage Rd
- 22416 S Kings Ct
- 24205 S Edwin Dr
- 23959 S Green Heron Dr
- 22524 S Deal Ave
- 24123 S Sandpiper Dr
- 22419 S Joseph Ave
- 22344 S Donna Ave
- 24519 S Edwin Dr
- 24241 W Hummingbird Dr
- 25200 W Pawnee Ln
- Sec8 W Eames St
- 4265 Mound Rd
- 24317 Schubert Ln
- 23210 S Frontage Rd W
- 23200 S Frontage Rd W
- 23219 W Albert Rd
- 24065 W Lawson Dr
- 24040 W Zauratsky Rd
- 24030 W Zauratsky Rd
- 24045 W Lawson Dr
- 24117 W Lawson Dr
- 24115 W Albert Rd
- 24050 W Zauratsky Rd
- 24125 W Albert Rd
- 23120 S Frontage Rd W
- 24030 W Lawson Dr
- Lot 1 W Zauratsky Rd
- 24115 S Canal Rd
- 24125 S Canal Rd
- 24135 S Canal Rd
- 24145 S Canal Rd
- 24145 W Albert Rd
- 23061 S Frontage Rd W