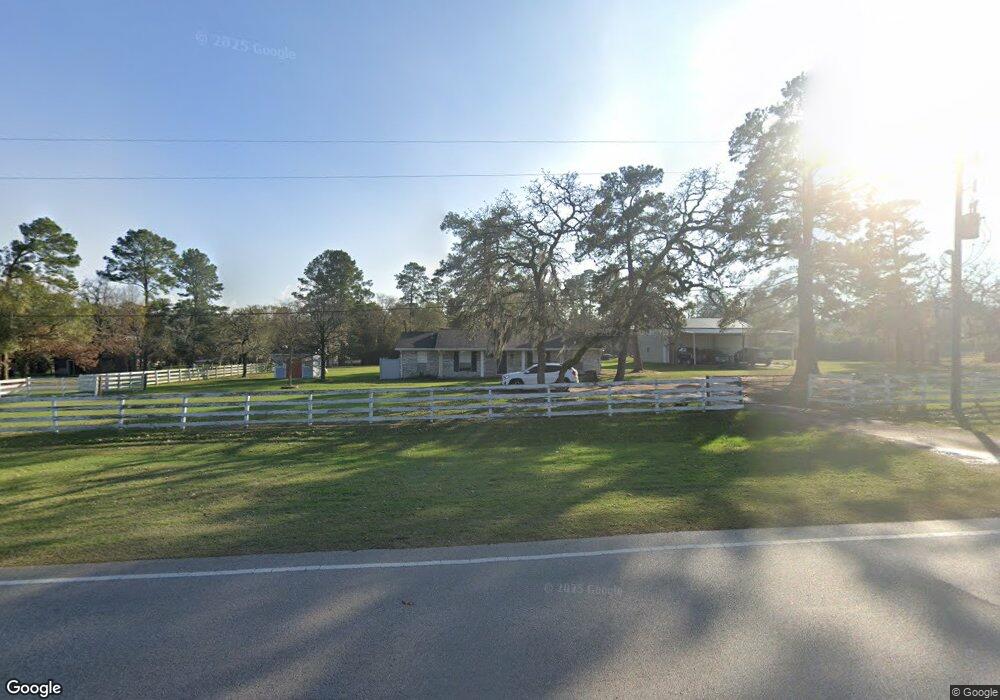
23218 Nichols Sawmill Rd Hockley, TX 77447
Clear Creek Forest NeighborhoodEstimated Value: $381,964 - $431,000
--
Bed
1
Bath
1,660
Sq Ft
$243/Sq Ft
Est. Value
About This Home
This home is located at 23218 Nichols Sawmill Rd, Hockley, TX 77447 and is currently estimated at $403,491, approximately $243 per square foot. 23218 Nichols Sawmill Rd is a home located in Montgomery County with nearby schools including J.L. Lyon Elementary School, Magnolia Sixth Grade Campus, and Magnolia Junior High School.
Ownership History
Date
Name
Owned For
Owner Type
Purchase Details
Closed on
Sep 7, 2007
Sold by
Wells Fargo Bank Na
Bought by
Smith James A
Current Estimated Value
Home Financials for this Owner
Home Financials are based on the most recent Mortgage that was taken out on this home.
Original Mortgage
$114,900
Outstanding Balance
$72,970
Interest Rate
6.63%
Mortgage Type
Purchase Money Mortgage
Estimated Equity
$330,521
Purchase Details
Closed on
Apr 5, 2007
Sold by
Fortune Marcy Ruth
Bought by
Smith James A
Purchase Details
Closed on
Jun 30, 2005
Sold by
Fortune H John and Fortune Gail M
Bought by
Fortune Marcella Ruth
Home Financials for this Owner
Home Financials are based on the most recent Mortgage that was taken out on this home.
Original Mortgage
$114,400
Interest Rate
7.4%
Mortgage Type
Purchase Money Mortgage
Create a Home Valuation Report for This Property
The Home Valuation Report is an in-depth analysis detailing your home's value as well as a comparison with similar homes in the area
Home Values in the Area
Average Home Value in this Area
Purchase History
| Date | Buyer | Sale Price | Title Company |
|---|---|---|---|
| Smith James A | -- | Lsi Title Agency Inc | |
| Smith James A | -- | -- | |
| Fortune Marcella Ruth | -- | -- |
Source: Public Records
Mortgage History
| Date | Status | Borrower | Loan Amount |
|---|---|---|---|
| Open | Smith James A | $114,900 | |
| Previous Owner | Fortune Marcella Ruth | $114,400 |
Source: Public Records
Tax History Compared to Growth
Tax History
| Year | Tax Paid | Tax Assessment Tax Assessment Total Assessment is a certain percentage of the fair market value that is determined by local assessors to be the total taxable value of land and additions on the property. | Land | Improvement |
|---|---|---|---|---|
| 2025 | $3,917 | $360,284 | -- | -- |
| 2024 | $3,496 | $327,531 | $109,188 | $218,343 |
| 2023 | $3,496 | $300,050 | $109,190 | $231,100 |
| 2022 | $4,813 | $272,770 | $94,340 | $231,140 |
| 2021 | $4,609 | $247,970 | $69,880 | $178,090 |
| 2020 | $4,690 | $231,750 | $69,880 | $164,930 |
| 2019 | $4,243 | $210,680 | $69,880 | $150,430 |
| 2018 | $3,497 | $191,530 | $41,060 | $150,470 |
| 2017 | $3,814 | $179,870 | $41,060 | $158,100 |
| 2016 | $3,467 | $163,520 | $41,060 | $158,130 |
| 2015 | $2,664 | $148,650 | $41,060 | $116,800 |
| 2014 | $2,664 | $134,180 | $21,830 | $123,080 |
Source: Public Records
Map
Nearby Homes
- 23602 Kings Forest Rd
- 22940 Nichols Sawmill Rd
- 23215 Nichols Sawmill Rd
- 2512 Harper Cliff Ct
- 24521 Magnolia Rd
- 2407 Emerie Arbor Ln
- 23702 Brushy Oaks St
- 2013 Stallion Lakes Ave
- 2302 Iris Cove Ct
- 22862 Magnolia Rd
- 22846 Magnolia Rd
- 22839 Magnolia Rd
- 23711 Saxon Way
- 23615 Roberts Cemetery Rd
- 2020 Stallion Lakes Ave
- 23719 Saxon Way
- 2000 Kallen Valley Ct
- 2068 Stallion Lakes Ave
- 2064 Stallion Lakes Ave
- 2028 Stallion Lakes Ave
- 23302 Nichols Sawmill Rd
- 23703 Kings Forest Rd
- 23200 Nichols Sawmill Rd
- 23305 Nichols Sawmill Rd
- 23706 Kings Forest Rd
- 23301 Nichols Sawmill Rd
- 23611 Kings Forest Rd
- 00 Nichols Sawmill
- 23314 Nichols Sawmill Rd
- 23186 Nichols Sawmill Rd
- 23318 Nichols Sawmill Rd
- 23309 Nichols Sawmill Rd
- 23603 Kings Forest Rd
- 22995 Nichols Sawmill Rd
- 23311 Forest Trail
- 23402 Forest Trail
- 23511 Kings Forest Rd
- 23401 Nichols Sawmill Rd
- lot5 Kings Forest Rd
- 23402 Nichols Sawmill Rd