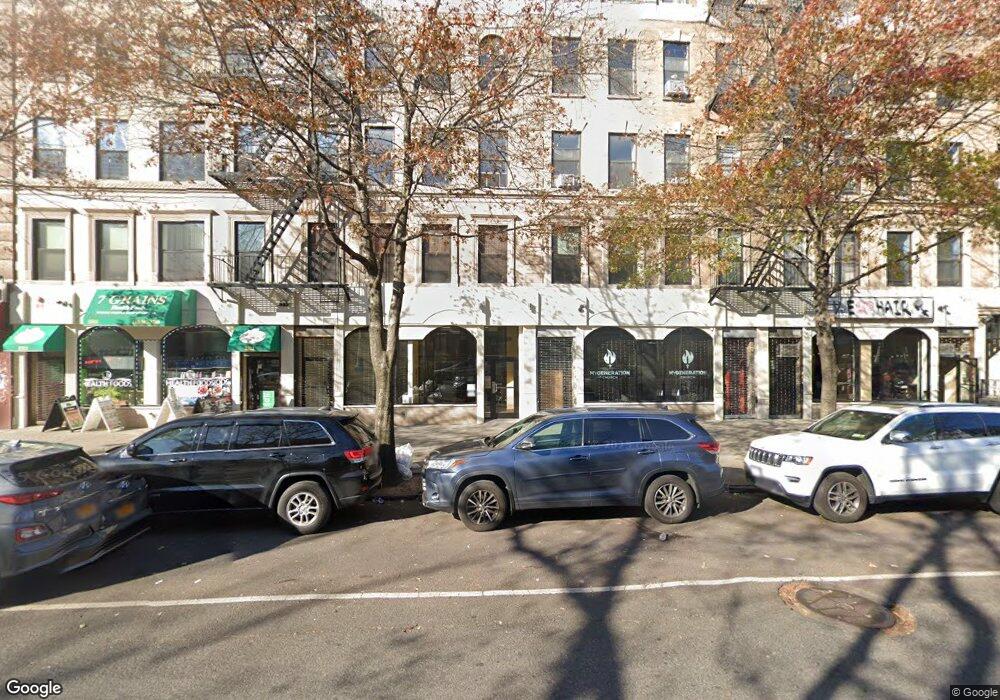
2322-2328 Adam Clayton Powell Jr Blvd Unit 4F New York, NY 10030
Strivers' Row NeighborhoodEstimated Value: $644,000 - $698,000
--
Bed
--
Bath
872
Sq Ft
$765/Sq Ft
Est. Value
About This Home
This home is located at 2322-2328 Adam Clayton Powell Jr Blvd Unit 4F, New York, NY 10030 and is currently estimated at $667,468, approximately $765 per square foot. 2322-2328 Adam Clayton Powell Jr Blvd Unit 4F is a home located in New York County with nearby schools including P.S. 123 Mahalia Jackson, Urban Assembly Academy for Future Leaders, and Harlem Village Academy West Lower Elementary.
Ownership History
Date
Name
Owned For
Owner Type
Purchase Details
Closed on
Jul 29, 2022
Sold by
Allon Cila
Bought by
Crosse Julie
Current Estimated Value
Home Financials for this Owner
Home Financials are based on the most recent Mortgage that was taken out on this home.
Original Mortgage
$480,000
Outstanding Balance
$459,588
Interest Rate
5.7%
Mortgage Type
Purchase Money Mortgage
Estimated Equity
$207,880
Purchase Details
Closed on
Jun 8, 2012
Sold by
Mclellan Neil P
Bought by
Allon Cila
Purchase Details
Closed on
Oct 23, 2007
Sold by
Henry Adam C
Bought by
Mclellan Neil P
Purchase Details
Closed on
Oct 29, 2003
Sold by
Powell Plaza Housing Development Fund Co
Bought by
Henry Adam C
Home Financials for this Owner
Home Financials are based on the most recent Mortgage that was taken out on this home.
Original Mortgage
$155,830
Interest Rate
5.96%
Mortgage Type
Purchase Money Mortgage
Create a Home Valuation Report for This Property
The Home Valuation Report is an in-depth analysis detailing your home's value as well as a comparison with similar homes in the area
Home Values in the Area
Average Home Value in this Area
Purchase History
| Date | Buyer | Sale Price | Title Company |
|---|---|---|---|
| Crosse Julie | $640,000 | -- | |
| Allon Cila | $377,000 | -- | |
| Mclellan Neil P | $470,000 | -- | |
| Henry Adam C | $162,900 | -- |
Source: Public Records
Mortgage History
| Date | Status | Borrower | Loan Amount |
|---|---|---|---|
| Open | Crosse Julie | $480,000 | |
| Previous Owner | Henry Adam C | $155,830 |
Source: Public Records
Tax History Compared to Growth
Tax History
| Year | Tax Paid | Tax Assessment Tax Assessment Total Assessment is a certain percentage of the fair market value that is determined by local assessors to be the total taxable value of land and additions on the property. | Land | Improvement |
|---|---|---|---|---|
| 2025 | $7,471 | $57,681 | $7,224 | $50,457 |
| 2024 | $7,471 | $59,762 | $7,224 | $52,538 |
| 2023 | $5,754 | $60,522 | $7,224 | $53,298 |
| 2022 | $6,848 | $55,974 | $7,224 | $48,750 |
| 2021 | $6,829 | $55,667 | $7,224 | $48,443 |
| 2020 | $6,422 | $63,887 | $7,224 | $56,663 |
| 2019 | $5,606 | $64,328 | $7,224 | $57,104 |
| 2018 | $5,402 | $63,860 | $7,224 | $56,636 |
| 2017 | $3,918 | $54,518 | $7,225 | $47,293 |
| 2016 | $2,738 | $48,837 | $7,225 | $41,612 |
| 2015 | -- | $45,553 | $7,224 | $38,329 |
| 2014 | -- | $42,878 | $7,224 | $35,654 |
Source: Public Records
Map
Nearby Homes
- 203 W 136th St
- 202 W 137th St
- 228 W 136th St
- 159 W 136th St
- 2351 Adam Clayton Powell Jr Blvd Unit PH18
- 2351 Adam Clayton Powell Jr Blvd Unit 208
- 2351 Adam Clayton Powell Jr Blvd Unit PH 16
- 2351 Adam Clayton Powell Jr Blvd Unit 614
- 2351 Adam Clayton Powell Jr Blvd Unit 205
- 2351 Adam Clayton Powell Jr Blvd Unit 315
- 2351 Adam Clayton Powell Jr Blvd Unit PH2
- 247 W 136th St
- 158 W 136th St
- 2351 Adam Clayton Powell Junior Blvd Unit PH27
- 2351 Adam C Powell Blvd Unit PH 27
- 188 W 135th St Unit 5W
- 203 W 138th St
- 146 W 136th St
- 237 W 135th St Unit 2A
- 237 W 135th St Unit 3A
- 2322-2328 Adam Clayton Powell Jr Blvd Unit 4D
- 2322-2328 Adam Clayton Powell Jr Blvd Unit 2A
- 2322-2328 Adam Clayton Powell Jr Blvd Unit 5D
- 2322-2328 Adam Clayton Powell Jr Blvd Unit 3D
- 2322-2328 Adam Clayton Powell Jr Blvd Unit 5F
- 2322-2328 Adam Clayton Powell Jr Blvd Unit 4A
- 2322-2328 Adam Clayton Powell Jr Blvd Unit 5C
- 2322-2328 Adam Clayton Powell Jr Blvd Unit 3C
- 2322-2328 Adam Clayton Powell Jr Blvd Unit 1C
- 2322-2328 Adam Clayton Powell Jr Blvd Unit 4B
- 2322-2328 Adam Clayton Powell Jr Blvd Unit 1D
- 2322-2328 Adam Clayton Powell Jr Blvd Unit 5E
- 2322-2328 Adam Clayton Powell Jr Blvd Unit 4C
- 2322-2328 Adam Clayton Powell Jr Blvd
- 2322-2328 Adam Clayton Powell Jr Blvd Unit 3H
- 2322-2328 Adam Clayton Powell Jr Blvd Unit 2D
- 2322-2328 Adam Clayton Powell Jr Blvd Unit STOR3
- 2322-2328 Adam Clayton Powell Jr Blvd Unit STOR2
- 2322-2328 Adam Clayton Powell Jr Blvd Unit STOR1
- 2322-2328 Adam Clayton Powell Jr Blvd Unit 2B