Estimated Value: $361,180 - $405,000
4
Beds
2
Baths
2,225
Sq Ft
$176/Sq Ft
Est. Value
About This Home
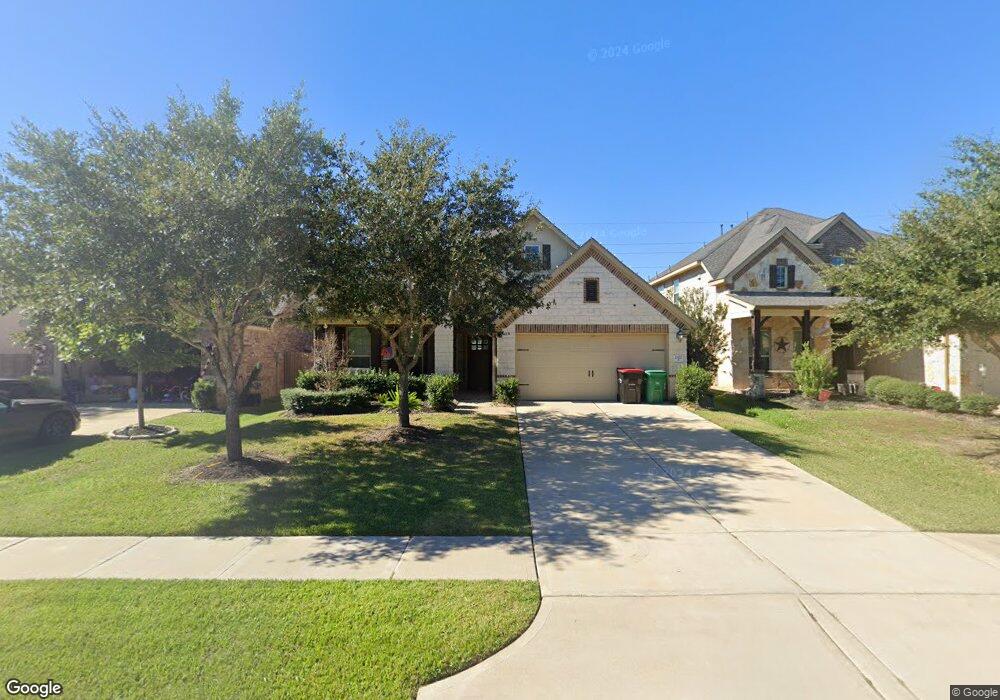
This home is located at 2322 Falcon Brook Dr, Katy, TX 77494 and is currently estimated at $392,295, approximately $176 per square foot. 2322 Falcon Brook Dr is a home located in Fort Bend County with nearby schools including Kathleen Joerger Lindsey Elementary School, Dean Leaman Junior High School, and Fulshear High School.
Ownership History
Date
Name
Owned For
Owner Type
Purchase Details
Closed on
Sep 17, 2020
Sold by
Strach Luek David and Strach Amie Rose
Bought by
Boyle Shana Y and Boyle Mark J
Current Estimated Value
Home Financials for this Owner
Home Financials are based on the most recent Mortgage that was taken out on this home.
Original Mortgage
$270,655
Outstanding Balance
$239,743
Interest Rate
2.8%
Mortgage Type
FHA
Estimated Equity
$152,552
Purchase Details
Closed on
Aug 8, 2018
Sold by
Ford Curtis
Bought by
Strech Luke David and Strech Amie Rose
Home Financials for this Owner
Home Financials are based on the most recent Mortgage that was taken out on this home.
Original Mortgage
$218,400
Interest Rate
4.5%
Mortgage Type
Purchase Money Mortgage
Purchase Details
Closed on
Oct 10, 2016
Sold by
Mhi Partnership Ltd
Bought by
Ford Curtis
Purchase Details
Closed on
Aug 5, 2015
Sold by
Jdc / Firethorne Ltd
Bought by
Ford Curtis
Purchase Details
Closed on
Nov 5, 2014
Sold by
Jdc / Firethorne Ltd
Bought by
Ford Curtis
Create a Home Valuation Report for This Property
The Home Valuation Report is an in-depth analysis detailing your home's value as well as a comparison with similar homes in the area
Home Values in the Area
Average Home Value in this Area
Purchase History
| Date | Buyer | Sale Price | Title Company |
|---|---|---|---|
| Boyle Shana Y | -- | Old Republic Natl Ttl Ins Co | |
| Strech Luke David | -- | None Available | |
| Ford Curtis | -- | Millennium Title Co | |
| Ford Curtis | -- | -- | |
| Ford Curtis | -- | -- |
Source: Public Records
Mortgage History
| Date | Status | Borrower | Loan Amount |
|---|---|---|---|
| Open | Boyle Shana Y | $270,655 | |
| Previous Owner | Strech Luke David | $218,400 |
Source: Public Records
Tax History Compared to Growth
Tax History
| Year | Tax Paid | Tax Assessment Tax Assessment Total Assessment is a certain percentage of the fair market value that is determined by local assessors to be the total taxable value of land and additions on the property. | Land | Improvement |
|---|---|---|---|---|
| 2025 | $2,134 | $118,680 | $19,417 | $99,263 |
| 2024 | $2,134 | $338,595 | $55,667 | $282,928 |
| 2023 | $1,961 | $339,670 | $26,532 | $313,138 |
| 2022 | $2,087 | $308,270 | $28,440 | $279,830 |
| 2021 | $2,158 | $83,490 | $13,580 | $69,910 |
| 2020 | $6,386 | $244,450 | $40,740 | $203,710 |
| 2019 | $6,599 | $235,350 | $38,800 | $196,550 |
| 2018 | $6,604 | $233,430 | $38,800 | $194,630 |
| 2017 | $6,803 | $237,530 | $38,800 | $198,730 |
| 2016 | $4,304 | $150,270 | $36,000 | $114,270 |
| 2015 | $57 | $3,050 | $3,050 | $0 |
Source: Public Records
Map
Nearby Homes
- 2322 Angel Trumpet Dr
- Bristol Plan at Jordan Ranch
- 2219 Grapewood Ln
- Prosperity Plan at Jordan Ranch
- Enchante Plan at Jordan Ranch
- Somerset Plan at Jordan Ranch
- Cambridge Plan at Jordan Ranch
- Sheffield Plan at Jordan Ranch
- Marshfield Plan at Jordan Ranch
- Reflection Plan at Jordan Ranch
- Serendipity Plan at Jordan Ranch
- 2231 Birch View Ln
- 2319 Red Chip Ln
- 2307 Red Chip Ln
- The Davenport Plan at Jordan Ranch - 50'
- The Fairfax III Plan at Jordan Ranch - 50'
- The Albany IX Plan at Jordan Ranch - 50'
- The Ellicott Plan at Jordan Ranch - 50'
- The Alden IX Plan at Jordan Ranch - 50'
- The Albany Plan at Jordan Ranch - 50'
- 2322 Falcon Brook Dr
- 2318 Falcon Brook Dr
- 2326 Falcon Brook Dr
- 2314 Falcon Brook Dr
- 2330 Falcon Brook Dr
- 2323 Falcon Brook Dr
- 2327 Falcon Brook Dr
- 2327 Falcon Brook Dr
- 2310 Falcon Brook Dr
- 2334 Falcon Brook Dr
- 2315 Falcon Brook Dr
- 2319 Falcon Brook Dr
- 2306 Falcon Brook Dr
- 2331 Falcon Brook Dr
- 2338 Falcon Brook Dr
- 2311 Falcon Brook Dr
- 2335 Falcon Brook Dr
- 2302 Falcon Brook Dr
- 2302 Falcon Brook Dr
- 2342 Falcon Brook Dr