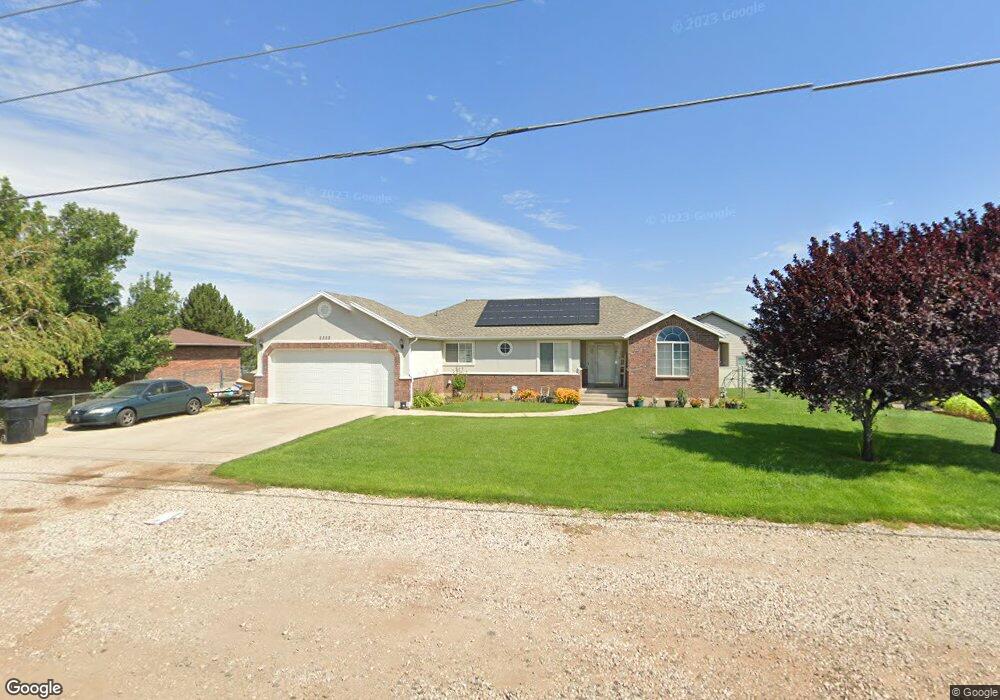
2322 W 1800 N Clearfield, UT 84015
Estimated Value: $460,000 - $541,000
5
Beds
2
Baths
3,060
Sq Ft
$165/Sq Ft
Est. Value
About This Home
This home is located at 2322 W 1800 N, Clearfield, UT 84015 and is currently estimated at $503,929, approximately $164 per square foot. 2322 W 1800 N is a home located in Davis County with nearby schools including West Clinton Elementary School, West Point Junior High School, and Clearfield High School.
Ownership History
Date
Name
Owned For
Owner Type
Purchase Details
Closed on
Aug 4, 2025
Sold by
Pyle Val Cody and Pyle Cassie
Bought by
Pyle Cassie and Pyle Val Cody
Current Estimated Value
Home Financials for this Owner
Home Financials are based on the most recent Mortgage that was taken out on this home.
Original Mortgage
$371,500
Outstanding Balance
$371,181
Interest Rate
6.77%
Mortgage Type
New Conventional
Estimated Equity
$132,748
Purchase Details
Closed on
Feb 17, 2016
Sold by
Fleming James A and Fleming Marinda
Bought by
Pyle Val Cody and Pyle Cassie
Purchase Details
Closed on
Jan 4, 2012
Sold by
Fleming James A and Fleming Marinda
Bought by
Fleming James A and Fleming Marinda
Home Financials for this Owner
Home Financials are based on the most recent Mortgage that was taken out on this home.
Original Mortgage
$212,050
Interest Rate
3.91%
Mortgage Type
New Conventional
Purchase Details
Closed on
Jul 6, 2006
Sold by
Draayer Brian D and Draayer Tiffany
Bought by
Fleming James A and Fleming Marinda
Home Financials for this Owner
Home Financials are based on the most recent Mortgage that was taken out on this home.
Original Mortgage
$207,240
Interest Rate
6.57%
Mortgage Type
VA
Purchase Details
Closed on
Jun 13, 2000
Sold by
Draayer Investment Company
Bought by
Draayer Brian D and Draayer Tiffany
Create a Home Valuation Report for This Property
The Home Valuation Report is an in-depth analysis detailing your home's value as well as a comparison with similar homes in the area
Home Values in the Area
Average Home Value in this Area
Purchase History
| Date | Buyer | Sale Price | Title Company |
|---|---|---|---|
| Pyle Cassie | -- | Pinnacle Title | |
| Pyle Cassie | -- | Pinnacle Title | |
| Pyle Val Cody | -- | Backman Title Services | |
| Fleming James A | -- | Hickman Land Title C | |
| Fleming James A | -- | Equity Title Ins Agency Inc | |
| Draayer Brian D | -- | -- |
Source: Public Records
Mortgage History
| Date | Status | Borrower | Loan Amount |
|---|---|---|---|
| Open | Pyle Cassie | $371,500 | |
| Closed | Pyle Cassie | $371,500 | |
| Previous Owner | Fleming James A | $212,050 | |
| Previous Owner | Fleming James A | $207,240 |
Source: Public Records
Tax History Compared to Growth
Tax History
| Year | Tax Paid | Tax Assessment Tax Assessment Total Assessment is a certain percentage of the fair market value that is determined by local assessors to be the total taxable value of land and additions on the property. | Land | Improvement |
|---|---|---|---|---|
| 2025 | $2,666 | $256,300 | $83,355 | $172,945 |
| 2024 | $2,555 | $246,950 | $90,409 | $156,541 |
| 2023 | $2,298 | $411,000 | $131,250 | $279,750 |
| 2022 | $2,491 | $246,400 | $77,053 | $169,347 |
| 2021 | $2,214 | $325,000 | $101,967 | $223,033 |
| 2020 | $1,942 | $282,000 | $89,693 | $192,307 |
| 2019 | $2,058 | $292,000 | $99,216 | $192,784 |
| 2018 | $1,922 | $268,000 | $83,095 | $184,905 |
| 2016 | $1,653 | $118,965 | $32,974 | $85,991 |
| 2015 | $1,591 | $108,900 | $32,974 | $75,926 |
| 2014 | $1,335 | $92,809 | $32,974 | $59,835 |
| 2013 | -- | $99,256 | $25,467 | $73,789 |
Source: Public Records
Map
Nearby Homes
- 2259 W 1800 N
- 1694 N 2225 W
- 2616 N 2125 W Unit 147
- 2148 W 1570 N
- 1648 N 2615 W
- Harvard Plan at Summerfield - Enclave
- 2208 W 2615 N
- Linden Plan at Summerfield - Vista
- Yale Plan at Summerfield - Enclave
- Gambel Oak Plan at Summerfield - Vista
- Cedar Plan at Summerfield - Vista
- Elm Plan at Summerfield - Vista
- Princeton Plan at Summerfield - Enclave
- Cambridge Plan at Summerfield - Enclave
- Cornell Plan at Summerfield - Enclave
- Sycamore Plan at Summerfield - Vista
- Berkeley Plan at Summerfield - Enclave
- Birch Plan at Summerfield - Vista
- Stanford Plan at Summerfield - Enclave
- 2034 N 2095 W
- 1807 N 2275 W
- 2317 W 1850 N Unit 103
- 2368 W 1800 N
- 2323 W 1850 N Unit 104
- 2337 W 1850 N Unit 105
- 2337 W 1850 N Unit 107
- 2303 W 1850 N Unit 102
- 2349 W 1850 N Unit 106
- 1778 N 2340 W
- 2382 W 1800 N
- 2307 W 1800 N
- 1766 N 2340 W
- 1771 N 2340 W
- 2367 W 1850 N
- 2318 W 1850 N Unit 116
- 2306 W 1850 N
- 2294 W 1850 N
- 2332 W 1850 N Unit 115
- 1784 N 2275 W
- 2402 W 1800 N