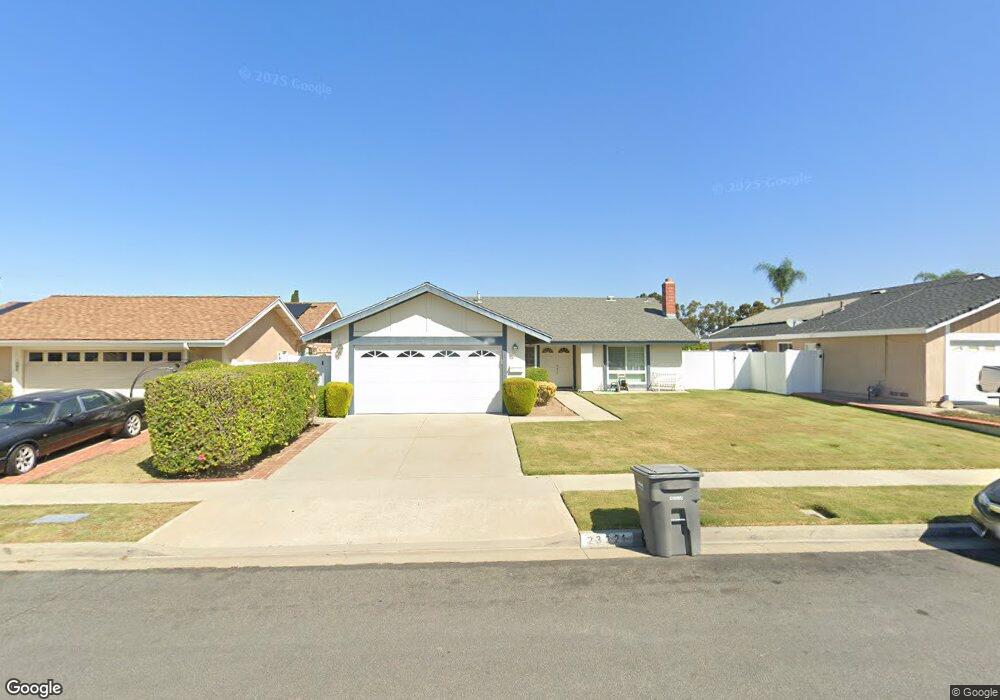
23221 Dune Mear Rd Lake Forest, CA 92630
Estimated Value: $1,155,455 - $1,279,000
4
Beds
2
Baths
1,564
Sq Ft
$781/Sq Ft
Est. Value
About This Home
This home is located at 23221 Dune Mear Rd, Lake Forest, CA 92630 and is currently estimated at $1,221,614, approximately $781 per square foot. 23221 Dune Mear Rd is a home located in Orange County with nearby schools including Olivewood Elementary School, Serrano Intermediate School, and El Toro High School.
Ownership History
Date
Name
Owned For
Owner Type
Purchase Details
Closed on
Aug 23, 2016
Sold by
Taylor Debora Ann
Bought by
Awalt Debora Ann and Taylor Debora Ann
Current Estimated Value
Purchase Details
Closed on
Apr 23, 1997
Sold by
Taylor Kenneth A and Taylor Debora Debora
Bought by
Taylor Debora Ann
Home Financials for this Owner
Home Financials are based on the most recent Mortgage that was taken out on this home.
Original Mortgage
$140,500
Outstanding Balance
$18,197
Interest Rate
7.91%
Estimated Equity
$1,203,417
Purchase Details
Closed on
Nov 12, 1993
Sold by
Taylor Kenneth A and Awalt Taylor Debora Ann
Bought by
Taylor Kenneth A and Awalt Taylor Debora A
Home Financials for this Owner
Home Financials are based on the most recent Mortgage that was taken out on this home.
Original Mortgage
$156,000
Interest Rate
6.74%
Create a Home Valuation Report for This Property
The Home Valuation Report is an in-depth analysis detailing your home's value as well as a comparison with similar homes in the area
Home Values in the Area
Average Home Value in this Area
Purchase History
| Date | Buyer | Sale Price | Title Company |
|---|---|---|---|
| Awalt Debora Ann | -- | None Available | |
| Taylor Debora Ann | -- | Fidelity National Title Ins | |
| Taylor Kenneth A | -- | North American Title Co |
Source: Public Records
Mortgage History
| Date | Status | Borrower | Loan Amount |
|---|---|---|---|
| Open | Taylor Debora Ann | $140,500 | |
| Closed | Taylor Kenneth A | $156,000 |
Source: Public Records
Tax History Compared to Growth
Tax History
| Year | Tax Paid | Tax Assessment Tax Assessment Total Assessment is a certain percentage of the fair market value that is determined by local assessors to be the total taxable value of land and additions on the property. | Land | Improvement |
|---|---|---|---|---|
| 2025 | $3,676 | $369,747 | $230,791 | $138,956 |
| 2024 | $3,676 | $362,498 | $226,266 | $136,232 |
| 2023 | $3,588 | $355,391 | $221,830 | $133,561 |
| 2022 | $3,523 | $348,423 | $217,480 | $130,943 |
| 2021 | $3,451 | $341,592 | $213,216 | $128,376 |
| 2020 | $3,420 | $338,090 | $211,030 | $127,060 |
| 2019 | $3,350 | $331,461 | $206,892 | $124,569 |
| 2018 | $3,286 | $324,962 | $202,835 | $122,127 |
| 2017 | $3,219 | $318,591 | $198,858 | $119,733 |
| 2016 | $3,165 | $312,345 | $194,959 | $117,386 |
| 2015 | $3,126 | $307,654 | $192,031 | $115,623 |
| 2014 | $3,056 | $301,628 | $188,269 | $113,359 |
Source: Public Records
Map
Nearby Homes
- 24481 Jutewood Place
- 24532 Corta Cresta Dr
- 24811 Calle el Toro Grande
- 24841 Calle el Toro Grande
- 22875 Ridge Route Ln
- 22941 Belquest Dr
- 23976 Carmel Dr
- 23672 Cavanaugh Rd
- 24922 Muirlands Blvd Unit 131
- 24922 Muirlands Blvd Unit 3
- 23681 Cavanaugh Rd
- 24210 Jasper Lake Ln Unit 52
- 23981 Crescent Rd
- 23216 Orange Ave Unit 6
- 23294 Orange Ave Unit 1
- 23220 Orange Ave Unit 2
- 23220 Orange Ave Unit 9
- 23214 Orange Ave Unit 7
- 23732 Cavanaugh Rd
- 23292 Orange Ave Unit 6
- 23211 Dune Mear Rd
- 23231 Dune Mear Rd
- 24492 Jutewood Place
- 24491 Jutewood Place
- 23201 Dune Mear Rd
- 23241 Dune Mear Rd
- 23222 Dune Mear Rd
- 23226 Dune Mear Rd
- 24482 Jutewood Place
- 23212 Dune Mear Rd
- 23232 Dune Mear Rd
- 24542 Bunbury Dr
- 24461 Redlen St
- 24532 Bunbury Dr
- 24471 Redlen St
- 23202 Dune Mear Rd
- 24451 Redlen St
- 23242 Dune Mear Rd
- 24471 Jutewood Place
- 24472 Jutewood Place