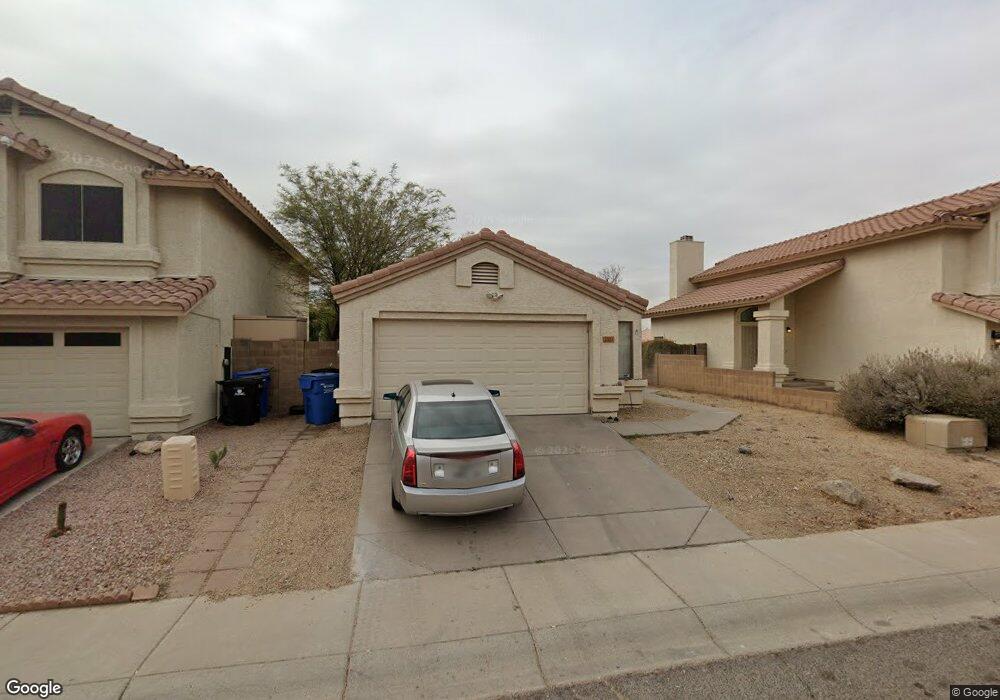
2323 E Taro Ln Phoenix, AZ 85024
Paradise Valley Village NeighborhoodEstimated Value: $362,085 - $430,000
Studio
3
Baths
1,285
Sq Ft
$313/Sq Ft
Est. Value
About This Home
This home is located at 2323 E Taro Ln, Phoenix, AZ 85024 and is currently estimated at $401,771, approximately $312 per square foot. 2323 E Taro Ln is a home located in Maricopa County with nearby schools including Eagle Ridge Elementary School, Mountain Trail Middle School, and North Canyon High School.
Ownership History
Date
Name
Owned For
Owner Type
Purchase Details
Closed on
Apr 23, 2008
Sold by
Odaffer Douglas Gary and Odaffer Susan
Bought by
Odaffer Douglas Gary and Odaffer Susan
Current Estimated Value
Purchase Details
Closed on
Jun 8, 2001
Sold by
Wise Charles A
Bought by
Odaffer Gary and Odaffer Susan
Home Financials for this Owner
Home Financials are based on the most recent Mortgage that was taken out on this home.
Original Mortgage
$100,000
Outstanding Balance
$38,092
Interest Rate
7.14%
Estimated Equity
$363,679
Purchase Details
Closed on
Jul 16, 1998
Sold by
Falen Jean M and Falen Larry E
Bought by
Wise Charles A
Home Financials for this Owner
Home Financials are based on the most recent Mortgage that was taken out on this home.
Original Mortgage
$83,200
Interest Rate
9.99%
Mortgage Type
New Conventional
Purchase Details
Closed on
Oct 31, 1996
Sold by
Paquin Jean M
Bought by
Falen Larry E and Falen Jean M
Create a Home Valuation Report for This Property
The Home Valuation Report is an in-depth analysis detailing your home's value as well as a comparison with similar homes in the area
Home Values in the Area
Average Home Value in this Area
Purchase History
| Date | Buyer | Sale Price | Title Company |
|---|---|---|---|
| Odaffer Douglas Gary | -- | None Available | |
| Odaffer Gary | $125,000 | Transnation Title Insurance | |
| Wise Charles A | $104,000 | Lawyers Title Of Arizona Inc | |
| Falen Larry E | -- | Transnation Title Ins Co |
Source: Public Records
Mortgage History
| Date | Status | Borrower | Loan Amount |
|---|---|---|---|
| Open | Odaffer Gary | $100,000 | |
| Previous Owner | Wise Charles A | $83,200 |
Source: Public Records
Tax History
| Year | Tax Paid | Tax Assessment Tax Assessment Total Assessment is a certain percentage of the fair market value that is determined by local assessors to be the total taxable value of land and additions on the property. | Land | Improvement |
|---|---|---|---|---|
| 2025 | $1,788 | $17,497 | -- | -- |
| 2024 | $1,705 | $16,664 | -- | -- |
| 2023 | $1,705 | $29,050 | $5,810 | $23,240 |
| 2022 | $1,688 | $21,700 | $4,340 | $17,360 |
| 2021 | $1,693 | $20,210 | $4,040 | $16,170 |
| 2020 | $1,641 | $18,950 | $3,790 | $15,160 |
| 2019 | $1,643 | $17,660 | $3,530 | $14,130 |
| 2018 | $1,589 | $15,710 | $3,140 | $12,570 |
| 2017 | $1,523 | $14,910 | $2,980 | $11,930 |
| 2016 | $1,498 | $14,280 | $2,850 | $11,430 |
| 2015 | $1,387 | $12,580 | $2,510 | $10,070 |
Source: Public Records
Map
Nearby Homes
- 19022 N 24th Place
- 19007 N 25th St
- 2412 E Rosemonte Dr
- 19226 N Cave Creek Rd Unit 128 to 139
- 2403 E Rosemonte Dr
- 18908 N 22nd St
- 18812 N 22nd St
- 19225 N Cave Creek Rd Unit 70
- 19225 N Cave Creek Rd Unit 83
- 19225 N Cave Creek Rd Unit 52
- 18611 N 22nd St Unit 44
- 19606 N 23rd Way
- 2701 E Utopia Rd Unit 208
- 2701 E Utopia Rd Unit 234
- 18416 N Cave Creek Rd Unit 1003
- 18416 N Cave Creek Rd Unit 1041
- 18416 N Cave Creek Rd Unit 3057
- 18416 N Cave Creek Rd Unit 2069
- 18644 N 21st St
- 2233 E Behrend Dr Unit 45
- 2319 E Taro Ln
- 2327 E Taro Ln
- 2315 E Taro Ln
- 2316 E Wescott Dr
- 19039 N 23rd Place
- 2311 E Taro Ln
- 2312 E Wescott Dr
- 19021 N 23rd Place
- 19043 N 23rd Place
- 2307 E Taro Ln
- 2308 E Wescott Dr
- 2312 E Taro Ln
- 19047 N 23rd Place
- 2304 E Wescott Dr
- 19017 N 23rd Place
- 2308 E Taro Ln
- 19051 N 23rd Place
- 19026 N 24th Place
- 2228 E Wescott Dr
- 19032 N 24th Place
Your Personal Tour Guide
Ask me questions while you tour the home.