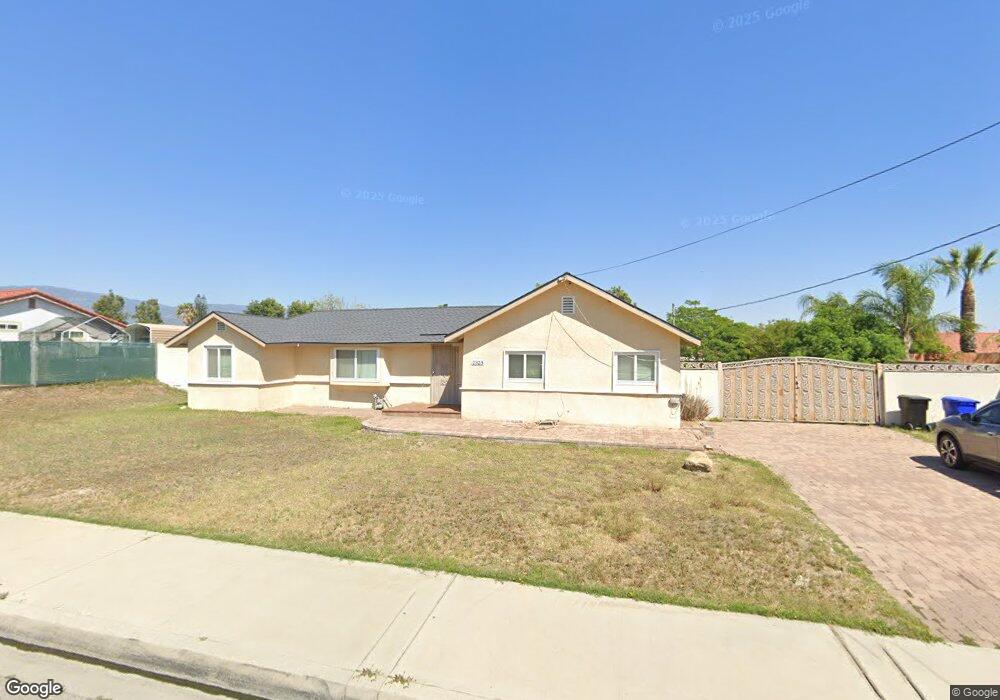
2323 N Cedar Ave Rialto, CA 92377
Estimated Value: $361,000 - $458,000
2
Beds
1
Bath
936
Sq Ft
$442/Sq Ft
Est. Value
About This Home
This home is located at 2323 N Cedar Ave, Rialto, CA 92377 and is currently estimated at $414,147, approximately $442 per square foot. 2323 N Cedar Ave is a home located in San Bernardino County with nearby schools including Trapp Elementary School, Kolb Middle School, and Wilmer Amina Carter High School.
Ownership History
Date
Name
Owned For
Owner Type
Purchase Details
Closed on
Mar 22, 2004
Sold by
Medina David and Magallanes Alma Patricia
Bought by
Medina David and Magallanes Alma Patricia
Current Estimated Value
Home Financials for this Owner
Home Financials are based on the most recent Mortgage that was taken out on this home.
Original Mortgage
$115,000
Outstanding Balance
$53,633
Interest Rate
5.64%
Mortgage Type
New Conventional
Estimated Equity
$360,514
Purchase Details
Closed on
Apr 8, 2000
Sold by
Unlimited Affordable Housing Llc
Bought by
Medina David and Magallanes Alma Patricia
Home Financials for this Owner
Home Financials are based on the most recent Mortgage that was taken out on this home.
Original Mortgage
$87,365
Interest Rate
8.18%
Mortgage Type
FHA
Purchase Details
Closed on
Dec 10, 1999
Sold by
Ervin Robert L
Bought by
Unlimited Affordable Housing
Purchase Details
Closed on
Jul 25, 1994
Sold by
Trainor Vivian Loretta
Bought by
Trainor Vivian Loretta
Create a Home Valuation Report for This Property
The Home Valuation Report is an in-depth analysis detailing your home's value as well as a comparison with similar homes in the area
Home Values in the Area
Average Home Value in this Area
Purchase History
| Date | Buyer | Sale Price | Title Company |
|---|---|---|---|
| Medina David | -- | Commonwealth Land Title Co | |
| Medina David | $87,500 | Benefit Land Title Ins Compa | |
| Unlimited Affordable Housing | $50,786 | Chicago Title Co | |
| Trainor Vivian Loretta | -- | -- |
Source: Public Records
Mortgage History
| Date | Status | Borrower | Loan Amount |
|---|---|---|---|
| Open | Medina David | $115,000 | |
| Previous Owner | Medina David | $87,365 |
Source: Public Records
Tax History Compared to Growth
Tax History
| Year | Tax Paid | Tax Assessment Tax Assessment Total Assessment is a certain percentage of the fair market value that is determined by local assessors to be the total taxable value of land and additions on the property. | Land | Improvement |
|---|---|---|---|---|
| 2025 | $2,040 | $134,486 | $33,620 | $100,866 |
| 2024 | $2,040 | $131,849 | $32,961 | $98,888 |
| 2023 | $2,148 | $129,264 | $32,315 | $96,949 |
| 2022 | $1,987 | $126,729 | $31,681 | $95,048 |
| 2021 | $1,977 | $124,244 | $31,060 | $93,184 |
| 2020 | $1,978 | $122,971 | $30,742 | $92,229 |
| 2019 | $1,941 | $120,560 | $30,139 | $90,421 |
| 2018 | $1,873 | $118,196 | $29,548 | $88,648 |
| 2017 | $1,862 | $115,879 | $28,969 | $86,910 |
| 2016 | $1,507 | $113,607 | $28,401 | $85,206 |
| 2015 | $1,513 | $111,900 | $27,974 | $83,926 |
| 2014 | $1,424 | $109,708 | $27,426 | $82,282 |
Source: Public Records
Map
Nearby Homes
- 1251 W Banyon St
- 1122 W Galway St
- 1388 Nicholas Ct
- 1520 W Norwood St
- 1074 W Casmalia St
- 18464 Banyon Ave
- 970 W Norwood St
- 2473 N Beechwood Ave
- 2598 Ayala Dr Unit 34
- 8139 N Maple Ave
- 2650 N Linden Ave
- 2425 N Fillmore Ave
- 0 W Persimmon Ave
- 1569 W Summit Ave
- 19244 Casmalia St
- 5737 Riverside Ave
- Residence Two Plan at Renaissance - Outbound
- Residence Three Plan at Renaissance - Runway
- Residence Two Plan at Renaissance - Runway
- Residence Three Plan at Renaissance - Outbound
- 2291 N Cedar Ave
- 2353 N Cedar Ave
- 2294 N Quince Ave
- 2273 N Cedar Ave
- 2276 N Quince Ave
- 1277 W Lewis St
- 6121 Cedar Ave
- 2348 N Cedar Ave
- 2310 N Cedar Ave
- 1272 W La Gloria Dr
- 2292 N Cedar Ave
- 1278 W Lewis St
- 2278 N Cedar Ave
- 2265 N Cedar Ave
- 2268 N Quince Ave
- 1259 W Lewis St
- 2388 N Cedar Ave
- 1258 W La Gloria Dr
- 1315 W Lewis St
- 2383 N Cedar Ave