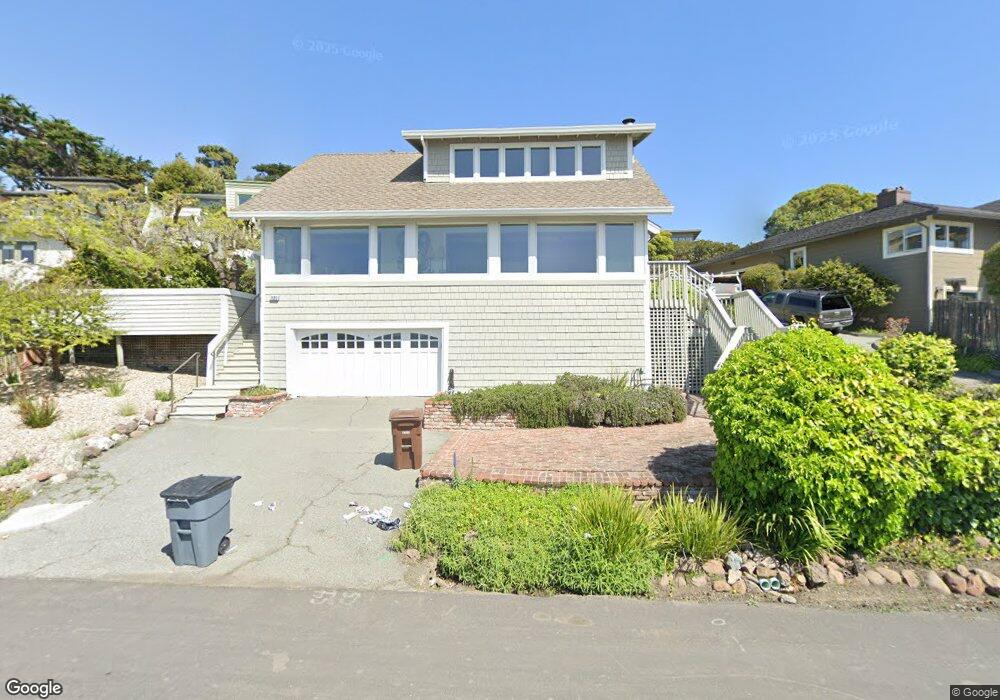
2323 Paradise Dr Belvedere Tiburon, CA 94920
Estimated Value: $2,634,000 - $3,251,000
3
Beds
2
Baths
2,138
Sq Ft
$1,372/Sq Ft
Est. Value
About This Home
This home is located at 2323 Paradise Dr, Belvedere Tiburon, CA 94920 and is currently estimated at $2,934,392, approximately $1,372 per square foot. 2323 Paradise Dr is a home located in Marin County with nearby schools including Reed Elementary School, Bel Aire Elementary School, and Del Mar Middle School.
Ownership History
Date
Name
Owned For
Owner Type
Purchase Details
Closed on
Nov 21, 2024
Sold by
Paradise Revocable Trust and Hardesty Karen Z
Bought by
Karen Zisch Hardesty Living Trust and Hardesty
Current Estimated Value
Purchase Details
Closed on
Sep 20, 1999
Sold by
Hardesty Karen Z
Bought by
Hardesty Karen Z
Purchase Details
Closed on
Dec 24, 1998
Sold by
Hardesty Karen Z
Bought by
Hardesty Karen Z
Purchase Details
Closed on
Dec 17, 1993
Sold by
Hardesty Karen
Bought by
Hardesty Thomas
Home Financials for this Owner
Home Financials are based on the most recent Mortgage that was taken out on this home.
Original Mortgage
$722,000
Interest Rate
7.09%
Purchase Details
Closed on
Dec 9, 1993
Sold by
Hardesty Thomas K
Bought by
Hardesty Karen
Home Financials for this Owner
Home Financials are based on the most recent Mortgage that was taken out on this home.
Original Mortgage
$722,000
Interest Rate
7.09%
Create a Home Valuation Report for This Property
The Home Valuation Report is an in-depth analysis detailing your home's value as well as a comparison with similar homes in the area
Home Values in the Area
Average Home Value in this Area
Purchase History
| Date | Buyer | Sale Price | Title Company |
|---|---|---|---|
| Karen Zisch Hardesty Living Trust | -- | None Listed On Document | |
| Karen Zisch Hardesty Living Trust | -- | None Listed On Document | |
| Hardesty Karen Z | -- | California Land Title Co | |
| Hardesty Karen Z | -- | Cal Land Title | |
| Hardesty Thomas | -- | -- | |
| Hardesty Karen | -- | -- | |
| Hardesty Karen | -- | -- |
Source: Public Records
Mortgage History
| Date | Status | Borrower | Loan Amount |
|---|---|---|---|
| Previous Owner | Hardesty Karen | $722,000 | |
| Closed | Hardesty Karen | $602,000 |
Source: Public Records
Tax History Compared to Growth
Tax History
| Year | Tax Paid | Tax Assessment Tax Assessment Total Assessment is a certain percentage of the fair market value that is determined by local assessors to be the total taxable value of land and additions on the property. | Land | Improvement |
|---|---|---|---|---|
| 2025 | $22,946 | $1,687,374 | $849,775 | $837,599 |
| 2024 | $22,946 | $1,654,294 | $833,115 | $821,179 |
| 2023 | $22,342 | $1,621,859 | $816,780 | $805,079 |
| 2022 | $21,750 | $1,590,060 | $800,765 | $789,295 |
| 2021 | $21,315 | $1,558,887 | $785,065 | $773,822 |
| 2020 | $21,150 | $1,542,912 | $777,020 | $765,892 |
| 2019 | $20,852 | $1,512,661 | $761,785 | $750,876 |
| 2018 | $20,406 | $1,483,006 | $746,850 | $736,156 |
| 2017 | $20,139 | $1,453,935 | $732,210 | $721,725 |
| 2016 | $19,409 | $1,425,432 | $717,855 | $707,577 |
| 2015 | $19,809 | $1,404,027 | $707,075 | $696,952 |
| 2014 | $19,264 | $1,376,528 | $693,225 | $683,303 |
Source: Public Records
Map
Nearby Homes
- 2350 Paradise Dr
- 2307 Spanish Trail Rd
- 2400 Vista Del Mar
- 2490 Spanish Trail Rd
- 2105 Mar St E
- 230 Diviso St
- 2002 Paradise Dr
- 403 Paradise Dr
- 1916 Mar West St Unit 128
- 24 Lagoon Vista
- 3 Bellevue Ave
- 45 Harbor Oak Dr Unit 14
- 121 Red Hill Cir
- 45 Corinthian Ct Unit 32
- 28 Marinero Cir Unit 34
- 22 Marinero Cir
- 1206 Mariner Way
- 6 Red Hill Cir Unit 3
- 2 Audrey Ct
- 60 Marinero Cir
- 2324 Vista Del Mar
- 2315 Paradise Dr
- 2343 Paradise Dr
- 2305 Paradise Dr
- 2310 Paradise Dr
- 2332 Paradise Dr
- 2295 Centro East St
- 2345 Paradise Dr
- 2310 Spanish Trail Rd
- 2300 Vista Del Mar
- 2298 Paradise Dr Unit 1
- 2336 Paradise Dr
- 11 Linda Vista Ave
- 15 Linda Vista Ave
- 2304 Spanish Trail Rd
- 17 Linda Vista Ave
- 2312 Spanish Trail Rd
- 19 Linda Vista Ave Unit 2
- 2340 Paradise Dr
- 2305 Centro East St