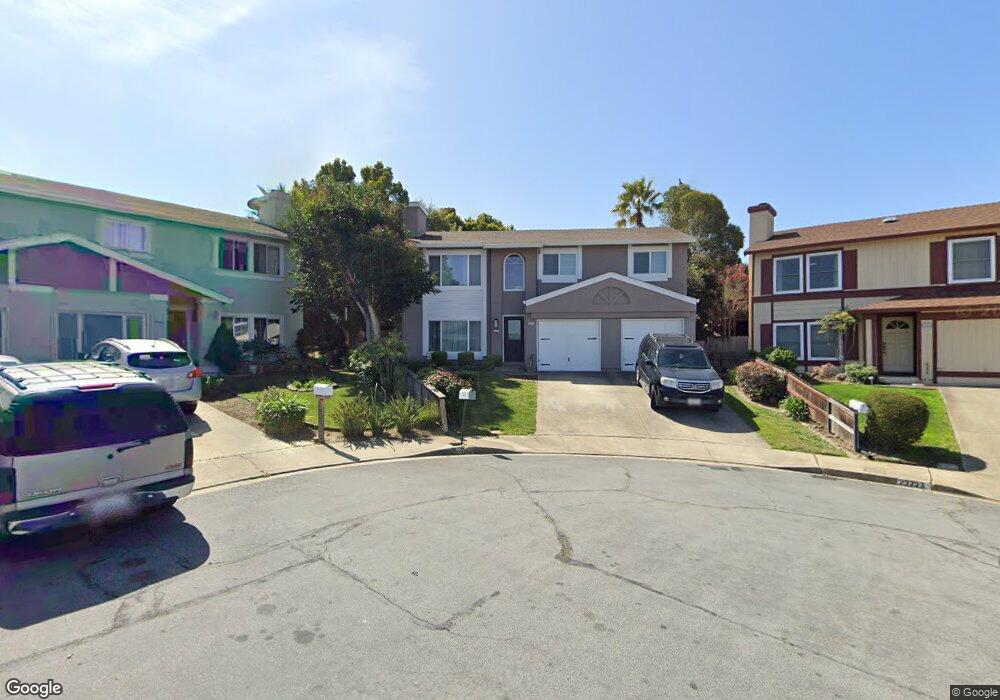
23231 Ernest Ct Hayward, CA 94541
Estimated Value: $939,258 - $1,017,000
3
Beds
2
Baths
1,640
Sq Ft
$599/Sq Ft
Est. Value
About This Home
This home is located at 23231 Ernest Ct, Hayward, CA 94541 and is currently estimated at $983,065, approximately $599 per square foot. 23231 Ernest Ct is a home located in Alameda County with nearby schools including Fairview Elementary School, Bret Harte Middle School, and Hayward High School.
Ownership History
Date
Name
Owned For
Owner Type
Purchase Details
Closed on
Aug 4, 2003
Sold by
Korf Brenda I
Bought by
Ford Jessica and Stanton Charles
Current Estimated Value
Purchase Details
Closed on
Sep 25, 2002
Sold by
Korf Collin C
Bought by
Korf Branda I
Home Financials for this Owner
Home Financials are based on the most recent Mortgage that was taken out on this home.
Original Mortgage
$336,800
Interest Rate
6.87%
Purchase Details
Closed on
Mar 23, 1998
Sold by
Ciglar Laurie A
Bought by
Korf Collin C and Korf Brenda I
Home Financials for this Owner
Home Financials are based on the most recent Mortgage that was taken out on this home.
Original Mortgage
$215,750
Interest Rate
6.87%
Purchase Details
Closed on
Oct 19, 1995
Sold by
Ciglar David Paul
Bought by
Ciglar Laurie Ann
Create a Home Valuation Report for This Property
The Home Valuation Report is an in-depth analysis detailing your home's value as well as a comparison with similar homes in the area
Home Values in the Area
Average Home Value in this Area
Purchase History
| Date | Buyer | Sale Price | Title Company |
|---|---|---|---|
| Ford Jessica | $508,000 | New Century Title Company | |
| Korf Branda I | -- | Alliance Title Company | |
| Korf Collin C | $240,000 | North American Title Co | |
| Ciglar Laurie Ann | -- | North American Title Co |
Source: Public Records
Mortgage History
| Date | Status | Borrower | Loan Amount |
|---|---|---|---|
| Previous Owner | Korf Branda I | $336,800 | |
| Previous Owner | Korf Collin C | $215,750 | |
| Closed | Korf Branda I | $63,150 |
Source: Public Records
Tax History
| Year | Tax Paid | Tax Assessment Tax Assessment Total Assessment is a certain percentage of the fair market value that is determined by local assessors to be the total taxable value of land and additions on the property. | Land | Improvement |
|---|---|---|---|---|
| 2025 | $1,574 | $65,928 | $22,830 | $43,098 |
| 2024 | $1,574 | $64,636 | $22,383 | $42,253 |
| 2023 | $1,584 | $63,369 | $21,944 | $41,425 |
| 2022 | $1,535 | $62,127 | $21,514 | $40,613 |
| 2021 | $1,496 | $60,909 | $21,092 | $39,817 |
| 2020 | $1,453 | $60,285 | $20,876 | $39,409 |
| 2019 | $1,437 | $59,103 | $20,467 | $38,636 |
| 2018 | $1,369 | $57,945 | $20,066 | $37,879 |
| 2017 | $1,334 | $56,808 | $19,672 | $37,136 |
| 2016 | $1,239 | $55,695 | $19,287 | $36,408 |
| 2015 | $1,210 | $54,858 | $18,997 | $35,861 |
| 2014 | $1,171 | $53,784 | $18,625 | $35,159 |
Source: Public Records
Map
Nearby Homes
- 3280 Ohlone Way
- 3250 Ridge Crest Ct
- 23049 Lakeridge Ave
- 3287 Kelly St
- 2851 Romagnolo St
- 3109 Vista Ln
- 23693 Glenbrook Ln
- 3241 Monika Ln
- 3285 Monika Ln
- 2332 D St
- 2973 Ralston Way
- 24785 Fairview Ave
- 25657 Crestfield Dr
- 2260 Romey Ln
- 2468 Hidden Ln
- 0 Hidden Oaks Dr Unit 41115723
- 22490 Bayview Ave
- 2272 Kelly St
- 23868 Fairlands Rd
- 0 Jensen Rd Unit 41089385
- 23223 Ernest Ct
- 3248 Jamie Way
- 23468 Mona Marie Ct
- 23446 Mona Marie Ct
- 3242 Jamie Way
- 3254 Jamie Way
- 23215 Ernest Ct
- 3236 Jamie Way
- 23224 Ernest Ct
- 23424 Mona Marie Ct
- 23216 Ernest Ct
- 23489 Mona Marie Ct
- 3230 Jamie Way
- 23207 Ernest Ct
- 3266 Jamie Way
- 3263 Shawn Way
- 23400 Mona Marie Ct
- 3224 Jamie Way
- 3272 Jamie Way
- 23467 Mona Marie Ct
Your Personal Tour Guide
Ask me questions while you tour the home.