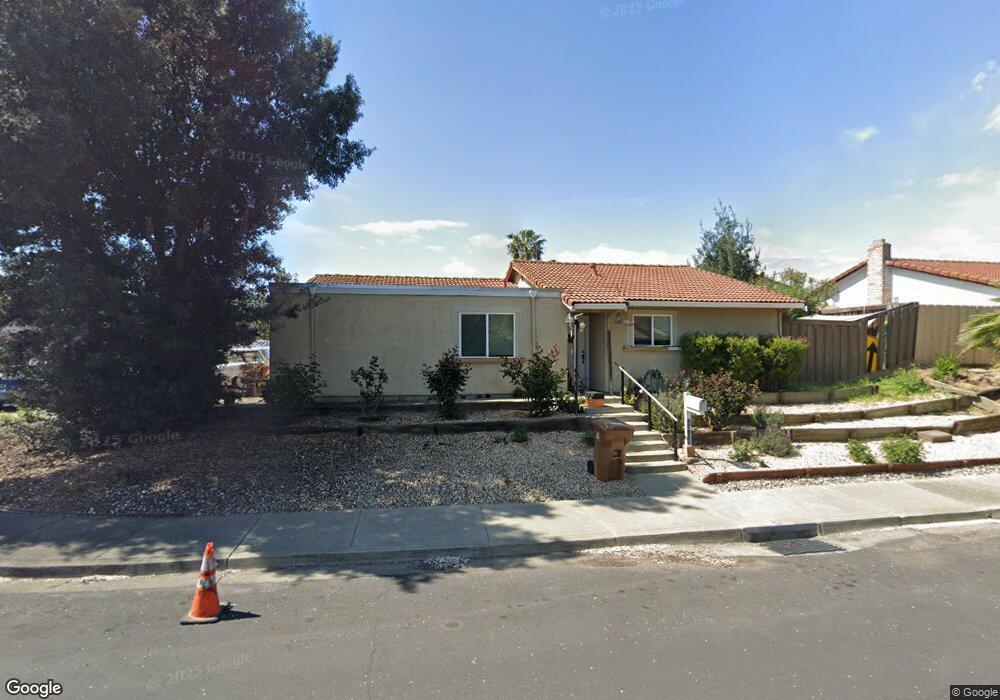
2324 Cypress St Antioch, CA 94509
Contra Loma NeighborhoodEstimated Value: $466,000 - $502,000
3
Beds
2
Baths
1,124
Sq Ft
$431/Sq Ft
Est. Value
About This Home
This home is located at 2324 Cypress St, Antioch, CA 94509 and is currently estimated at $484,492, approximately $431 per square foot. 2324 Cypress St is a home located in Contra Costa County with nearby schools including Mission Elementary School, Park Middle School, and Antioch High School.
Ownership History
Date
Name
Owned For
Owner Type
Purchase Details
Closed on
Dec 3, 2020
Sold by
Hagen Ronald P
Bought by
Ronald P Hagen Revocable Trust
Current Estimated Value
Purchase Details
Closed on
Aug 16, 2019
Sold by
Self Paul
Bought by
Hagen Ronald P
Home Financials for this Owner
Home Financials are based on the most recent Mortgage that was taken out on this home.
Original Mortgage
$80,000
Interest Rate
3.7%
Mortgage Type
New Conventional
Purchase Details
Closed on
Oct 11, 2011
Sold by
Lin Stella
Bought by
Self Paul
Home Financials for this Owner
Home Financials are based on the most recent Mortgage that was taken out on this home.
Original Mortgage
$121,343
Interest Rate
4.01%
Mortgage Type
FHA
Purchase Details
Closed on
Oct 5, 2007
Sold by
Lin Stella
Bought by
Lin Stella
Purchase Details
Closed on
Sep 11, 2007
Sold by
Lin Stella
Bought by
Fong Wyman K and Lin Stella
Purchase Details
Closed on
Jul 7, 2000
Sold by
Fong Wyman K Tre and Lin Stella Tre
Bought by
Lin Stella
Create a Home Valuation Report for This Property
The Home Valuation Report is an in-depth analysis detailing your home's value as well as a comparison with similar homes in the area
Home Values in the Area
Average Home Value in this Area
Purchase History
| Date | Buyer | Sale Price | Title Company |
|---|---|---|---|
| Ronald P Hagen Revocable Trust | -- | None Listed On Document | |
| Hagen Ronald P | $350,000 | Chicago Title Company | |
| Self Paul | $124,500 | North American Title | |
| Lin Stella | -- | None Available | |
| Lin Stella | -- | None Available | |
| Lin Stella | -- | None Available | |
| Fong Wyman K | -- | None Available | |
| Lin Stella | -- | -- |
Source: Public Records
Mortgage History
| Date | Status | Borrower | Loan Amount |
|---|---|---|---|
| Previous Owner | Hagen Ronald P | $80,000 | |
| Previous Owner | Self Paul | $121,343 |
Source: Public Records
Tax History
| Year | Tax Paid | Tax Assessment Tax Assessment Total Assessment is a certain percentage of the fair market value that is determined by local assessors to be the total taxable value of land and additions on the property. | Land | Improvement |
|---|---|---|---|---|
| 2025 | $4,849 | $382,771 | $196,854 | $185,917 |
| 2024 | $4,606 | $375,267 | $192,995 | $182,272 |
| 2023 | $4,606 | $367,910 | $189,211 | $178,699 |
| 2022 | $4,457 | $360,697 | $185,501 | $175,196 |
| 2021 | $4,281 | $353,625 | $181,864 | $171,761 |
| 2019 | $2,022 | $140,177 | $28,146 | $112,031 |
| 2018 | $1,951 | $137,430 | $27,595 | $109,835 |
| 2017 | $1,896 | $134,736 | $27,054 | $107,682 |
| 2016 | $1,841 | $132,095 | $26,524 | $105,571 |
| 2015 | $1,815 | $130,112 | $26,126 | $103,986 |
| 2014 | $1,758 | $127,565 | $25,615 | $101,950 |
Source: Public Records
Map
Nearby Homes
- 3101 Cedar Ct
- 17 Bradley Ln
- 2453 Cypress St
- 1 Mark Ln
- 3205 Muir Ct
- 2850 Petar Place
- 2916 Garfield Place
- 3301 Buchanan Rd Unit 85
- 3301 Buchanan Rd Unit 89
- 3301 Buchanan Rd Unit 47
- 3301 Buchanan Rd Unit 118
- 1808 Johnson Dr
- 2204 Tyler Ct
- 2607 Ithaca Ct
- 2502 Princeton Ln
- 2503 Princeton Ln
- 2709 Cabrillo Ct
- 2005 San Jose Dr Unit 231
- 2005 San Jose Dr
- 2604 Carlton Ln
- 2328 Cypress St
- 2331 Sequoia Dr
- 2332 Cypress St
- 2335 Sequoia Dr
- 2339 Sequoia Dr
- 2336 Cypress St
- 2323 Sequoia Dr
- 2325 Cypress St
- 2329 Cypress St
- 2343 Sequoia Dr
- 2317 Cypress St
- 2313 Cypress St
- 2301 Cypress St
- 2321 Cypress St
- 2333 Cypress St
- 2340 Cypress St
- 2309 Cypress St
- 2319 Sequoia Dr
- 2305 Cypress St
- 2347 Sequoia Dr
Your Personal Tour Guide
Ask me questions while you tour the home.