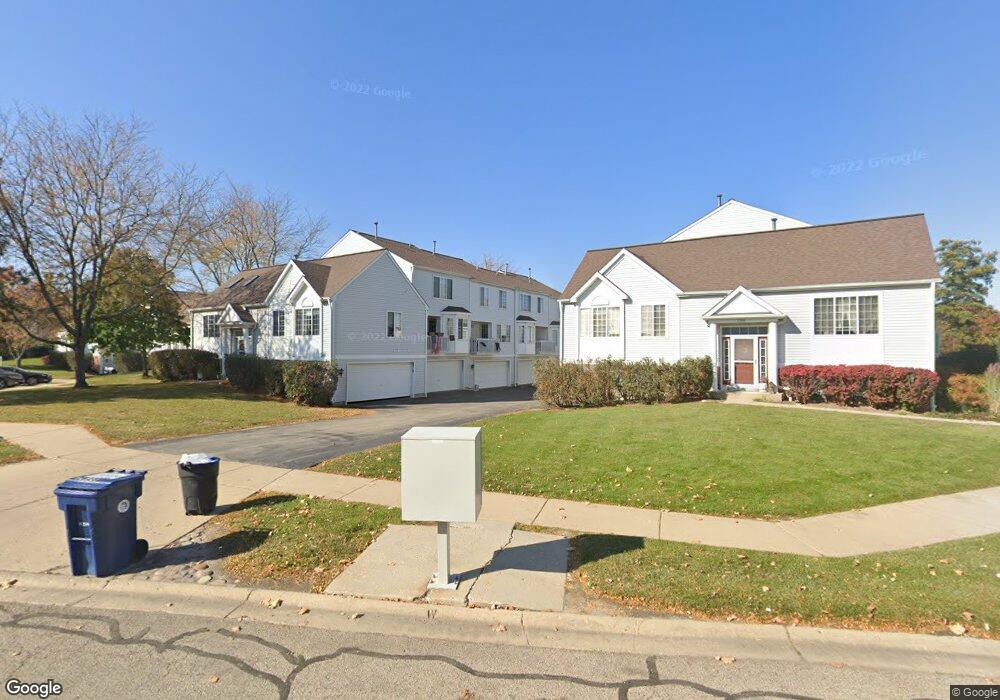
2324 Dawson Ln Unit 214 Algonquin, IL 60102
Estimated Value: $234,094 - $268,000
2
Beds
2
Baths
1,113
Sq Ft
$231/Sq Ft
Est. Value
About This Home
This home is located at 2324 Dawson Ln Unit 214, Algonquin, IL 60102 and is currently estimated at $257,274, approximately $231 per square foot. 2324 Dawson Ln Unit 214 is a home located in McHenry County with nearby schools including Westfield Community School, Lincoln Prairie Elementary School, and Harry D Jacobs High School.
Ownership History
Date
Name
Owned For
Owner Type
Purchase Details
Closed on
Aug 1, 2007
Sold by
Jacob Valerie J
Bought by
Jacob Valerie J and Jacob Jessica D
Current Estimated Value
Home Financials for this Owner
Home Financials are based on the most recent Mortgage that was taken out on this home.
Original Mortgage
$126,700
Outstanding Balance
$82,085
Interest Rate
7.12%
Mortgage Type
New Conventional
Estimated Equity
$175,189
Purchase Details
Closed on
Dec 21, 2001
Sold by
Jacob Joseph T
Bought by
Jacob Valerie J
Home Financials for this Owner
Home Financials are based on the most recent Mortgage that was taken out on this home.
Original Mortgage
$89,000
Interest Rate
7.07%
Purchase Details
Closed on
Sep 30, 1996
Sold by
Pulte Home Corp
Bought by
Jacob Valerie J and Jacob Joseph T
Home Financials for this Owner
Home Financials are based on the most recent Mortgage that was taken out on this home.
Original Mortgage
$89,400
Interest Rate
7.97%
Mortgage Type
FHA
Create a Home Valuation Report for This Property
The Home Valuation Report is an in-depth analysis detailing your home's value as well as a comparison with similar homes in the area
Home Values in the Area
Average Home Value in this Area
Purchase History
| Date | Buyer | Sale Price | Title Company |
|---|---|---|---|
| Jacob Valerie J | -- | Chicago Title | |
| Jacob Valerie J | -- | Ticor Title | |
| Jacob Valerie J | $118,500 | First American Title |
Source: Public Records
Mortgage History
| Date | Status | Borrower | Loan Amount |
|---|---|---|---|
| Open | Jacob Valerie J | $126,700 | |
| Closed | Jacob Valerie J | $89,000 | |
| Closed | Jacob Valerie J | $89,400 |
Source: Public Records
Tax History Compared to Growth
Tax History
| Year | Tax Paid | Tax Assessment Tax Assessment Total Assessment is a certain percentage of the fair market value that is determined by local assessors to be the total taxable value of land and additions on the property. | Land | Improvement |
|---|---|---|---|---|
| 2024 | $4,250 | $62,334 | $14,040 | $48,294 |
| 2023 | $3,997 | $55,750 | $12,557 | $43,193 |
| 2022 | $3,746 | $49,679 | $11,160 | $38,519 |
| 2021 | $3,574 | $46,282 | $10,397 | $35,885 |
| 2020 | $3,470 | $44,644 | $10,029 | $34,615 |
| 2019 | $3,373 | $42,730 | $9,599 | $33,131 |
| 2018 | $3,191 | $39,473 | $8,867 | $30,606 |
| 2017 | $3,106 | $37,186 | $8,353 | $28,833 |
| 2016 | $3,037 | $34,877 | $7,834 | $27,043 |
| 2013 | -- | $36,812 | $7,308 | $29,504 |
Source: Public Records
Map
Nearby Homes
- 2248 Dawson Ln Unit 272
- 2235 Dawson Ln
- 661 Majestic Dr
- 741 Regal Ln
- 1820 Crofton Dr
- 700 Fairfield Ln
- 2161 Burnham Ct
- 2801 Waterfront Ave
- 000 County Line Rd
- 601 Woods Creek Ln
- 2601 Harnish Dr
- 2611 Harnish Dr
- DOVER Plan at Grand Reserve - Algonquin
- CLIFTON Plan at Grand Reserve - Algonquin
- 2631 Harnish Dr
- 1 Wander Way
- 2043 Peach Tree Ln Unit 4122
- 2101 Peach Tree Ln Unit 4094
- 135 Arquilla Dr
- 12 White Oak Ct
- 2326 Dawson Ln Unit 215
- 2320 Dawson Ln Unit 212
- 2328 Dawson Ln Unit 216
- 2322 Dawson Ln Unit 213
- 2318 Dawson Ln Unit 211
- 2318 Dawson Ln Unit 2318
- 2310 Dawson Ln Unit 224
- 2308 Dawson Ln Unit 225
- 2314 Dawson Ln Unit 222
- 2312 Dawson Ln Unit 223
- 2306 Dawson Ln Unit 226
- 2316 Dawson Ln
- 2336 Dawson Ln Unit 203
- 2336 Dawson Ln Unit 2336
- 2340 Dawson Ln
- 2352 Dawson Ln Unit 196
- 2338 Dawson Ln Unit 202
- 2346 Dawson Ln Unit 193
- 2330 Dawson Ln Unit 206
- 2332 Dawson Ln Unit 205