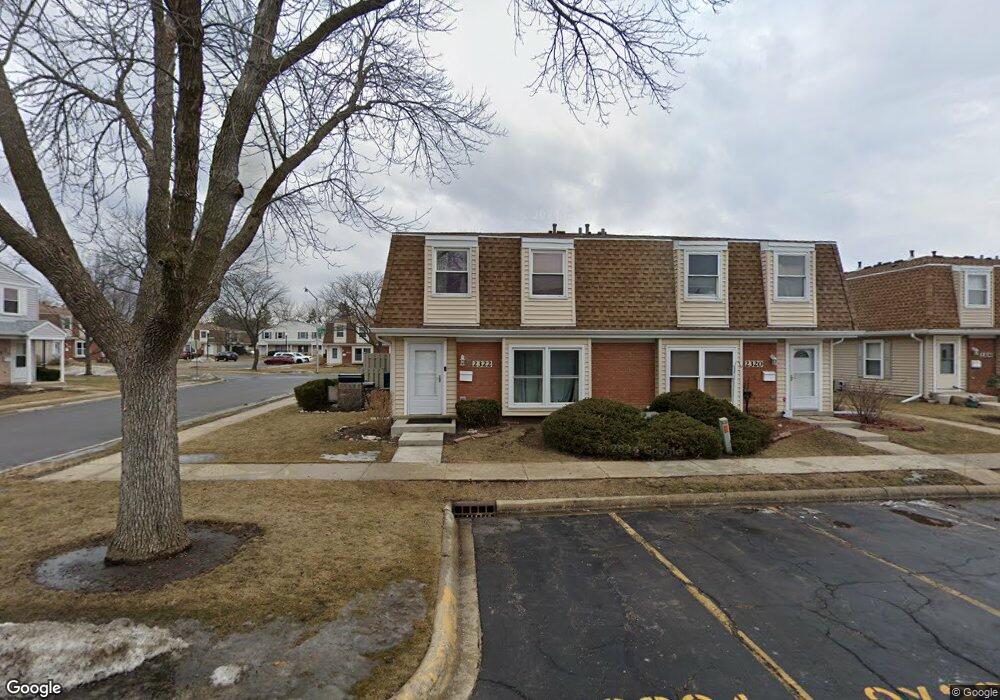
2324 Oxhill Ct Unit 693 Schaumburg, IL 60194
West Schaumburg NeighborhoodEstimated Value: $226,000 - $259,000
2
Beds
--
Bath
--
Sq Ft
18.06
Acres
About This Home
This home is located at 2324 Oxhill Ct Unit 693, Schaumburg, IL 60194 and is currently estimated at $238,757. 2324 Oxhill Ct Unit 693 is a home located in Cook County with nearby schools including Elizabeth Blackwell Elementary School, Jane Addams Junior High School, and Hoffman Estates High School.
Ownership History
Date
Name
Owned For
Owner Type
Purchase Details
Closed on
Oct 28, 2005
Sold by
Vargas Jose
Bought by
Ryer Jeffrey C
Current Estimated Value
Home Financials for this Owner
Home Financials are based on the most recent Mortgage that was taken out on this home.
Original Mortgage
$130,400
Interest Rate
6.48%
Mortgage Type
New Conventional
Purchase Details
Closed on
Dec 30, 2004
Sold by
Paz Cherlton L
Bought by
Vargas Jose
Home Financials for this Owner
Home Financials are based on the most recent Mortgage that was taken out on this home.
Original Mortgage
$123,200
Interest Rate
8.55%
Mortgage Type
Unknown
Purchase Details
Closed on
Mar 18, 1999
Sold by
Arnold Charles W and Arnold Silvia C
Bought by
Paz Cherlton L
Home Financials for this Owner
Home Financials are based on the most recent Mortgage that was taken out on this home.
Original Mortgage
$83,950
Interest Rate
6.94%
Mortgage Type
FHA
Create a Home Valuation Report for This Property
The Home Valuation Report is an in-depth analysis detailing your home's value as well as a comparison with similar homes in the area
Home Values in the Area
Average Home Value in this Area
Purchase History
| Date | Buyer | Sale Price | Title Company |
|---|---|---|---|
| Ryer Jeffrey C | $163,000 | Superior Title Co | |
| Vargas Jose | $154,000 | Stewart Title Guaranty Compa | |
| Paz Cherlton L | $86,000 | -- |
Source: Public Records
Mortgage History
| Date | Status | Borrower | Loan Amount |
|---|---|---|---|
| Previous Owner | Ryer Jeffrey C | $130,400 | |
| Previous Owner | Vargas Jose | $123,200 | |
| Previous Owner | Paz Cherlton L | $83,950 | |
| Closed | Vargas Jose | $30,800 |
Source: Public Records
Tax History Compared to Growth
Tax History
| Year | Tax Paid | Tax Assessment Tax Assessment Total Assessment is a certain percentage of the fair market value that is determined by local assessors to be the total taxable value of land and additions on the property. | Land | Improvement |
|---|---|---|---|---|
| 2024 | $2,682 | $15,503 | $2,185 | $13,318 |
| 2023 | $2,554 | $15,503 | $2,185 | $13,318 |
| 2022 | $2,554 | $15,503 | $2,185 | $13,318 |
| 2021 | $1,990 | $12,500 | $3,823 | $8,677 |
| 2020 | $3,771 | $12,500 | $3,823 | $8,677 |
| 2019 | $3,785 | $13,907 | $3,823 | $10,084 |
| 2018 | $3,013 | $9,879 | $3,222 | $6,657 |
| 2017 | $2,958 | $9,879 | $3,222 | $6,657 |
| 2016 | $2,772 | $9,879 | $3,222 | $6,657 |
| 2015 | $2,429 | $7,985 | $2,840 | $5,145 |
| 2014 | $2,403 | $7,985 | $2,840 | $5,145 |
| 2013 | $2,402 | $8,185 | $2,840 | $5,345 |
Source: Public Records
Map
Nearby Homes
- 2300 Flower Ct Unit 136
- 10 Warwick Ct
- 155 Hastings Mill Rd
- 2312 Hyde Ct
- 2214 Dorchester Ct Unit 53
- 2342 Hamilton Place
- 2201 Brittany Ct Unit 20
- 2216 Andover Ct
- 2128 Hitching Post Ln
- 290 Green Knoll Ln Unit 1920
- 307 Glasgow Ln Unit V2
- 150 White Branch Ct N Unit 443
- 508 N Walnut Ln
- 205 Glasgow Ln Unit V1
- 133 White Branch Ct S Unit 539
- 413 Linsey Ave
- 208 Judy Ln
- 2317 Broadway Ln
- 368 Glen Byrn Ct Unit 11368A
- 454 Willington Dr
- 2320 Oxhill Ct Unit 723
- 2326 Oxhill Ct Unit 703
- 2322 Oxhill Ct Unit 713
- 2318 Oxhill Ct Unit 743
- 2316 Oxhill Ct Unit 733
- 2312 Oxhill Ct Unit 763
- 2314 Oxhill Ct Unit 753
- 2310 Oxhill Ct Unit 803
- 465 Onyx Ct Unit 653
- 461 Onyx Ct Unit 683
- 463 Onyx Ct Unit 673
- 467 Onyx Ct Unit 663
- 2329 Oxhill Ct Unit 813
- 2306 Old Kings Ct Unit 183
- 2325 Oxhill Ct Unit 833
- 2304 Oxhill Ct Unit 773
- 2308 Oxhill Ct Unit 793
- 2323 Oxhill Ct Unit 843
- 2306 Oxhill Ct Unit 783
- 2327 Oxhill Ct Unit 823