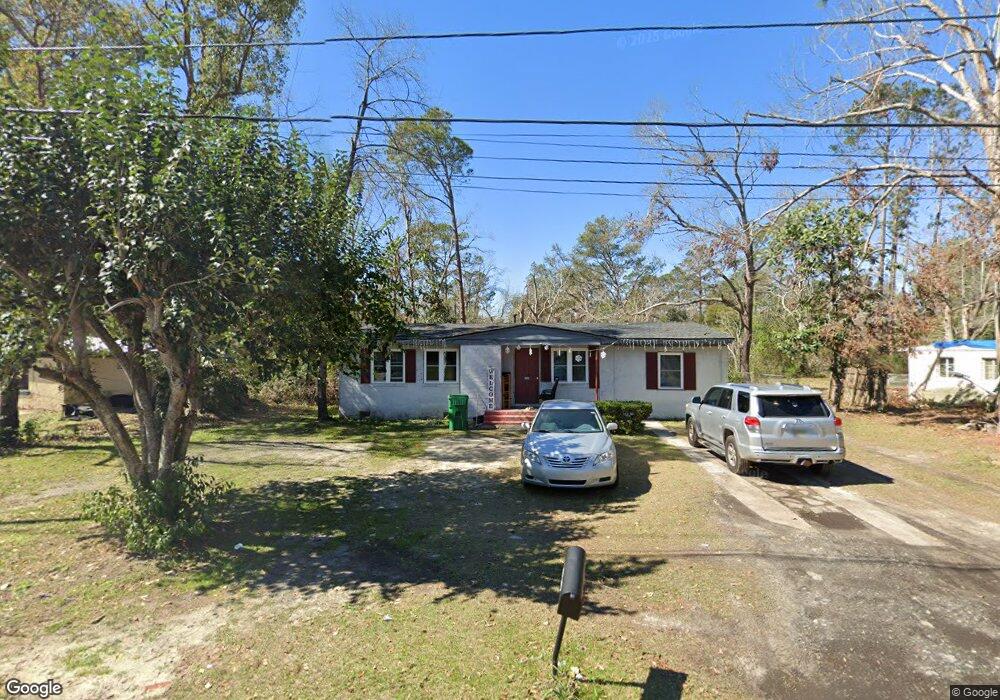
2324 Sterling Place Valdosta, GA 31602
Estimated Value: $58,000 - $78,000
3
Beds
1
Bath
1,124
Sq Ft
$60/Sq Ft
Est. Value
About This Home
This home is located at 2324 Sterling Place, Valdosta, GA 31602 and is currently estimated at $68,000, approximately $60 per square foot. 2324 Sterling Place is a home located in Lowndes County with nearby schools including W.G. Nunn Elementary School, Newbern Middle School, and Valdosta High School.
Ownership History
Date
Name
Owned For
Owner Type
Purchase Details
Closed on
Sep 5, 2019
Sold by
Wallace Billy Lee
Bought by
Wallace Louella
Current Estimated Value
Home Financials for this Owner
Home Financials are based on the most recent Mortgage that was taken out on this home.
Original Mortgage
$31,385
Interest Rate
3.6%
Mortgage Type
New Conventional
Purchase Details
Closed on
Oct 14, 2003
Sold by
Wallace Louella K
Bought by
Wallace Billy L
Purchase Details
Closed on
Oct 3, 2002
Sold by
Murphy Calvin G
Bought by
Wallace Billy L
Purchase Details
Closed on
May 25, 1983
Sold by
Murphy Calvin G
Bought by
Murphy Patricia A
Purchase Details
Closed on
Jul 6, 1978
Bought by
Mcdaniel Edwin Lee
Purchase Details
Closed on
Nov 4, 1977
Bought by
Smithwick Melvin F Etal
Purchase Details
Closed on
May 11, 1965
Bought by
Ryan Clarence Jr Etal
Create a Home Valuation Report for This Property
The Home Valuation Report is an in-depth analysis detailing your home's value as well as a comparison with similar homes in the area
Home Values in the Area
Average Home Value in this Area
Purchase History
| Date | Buyer | Sale Price | Title Company |
|---|---|---|---|
| Wallace Louella | -- | -- | |
| Bernier Diversified Holdings Llc | $34,500 | -- | |
| Wallace Billy L | -- | -- | |
| Wallace Billy L | $31,500 | -- | |
| Murphy Patricia A | $32,400 | -- | |
| Murphy Calvin G | $32,400 | -- | |
| Mcdaniel Edwin Lee | $4,000 | -- | |
| Smithwick Melvin F Etal | $20,500 | -- | |
| Ryan Clarence Jr Etal | -- | -- |
Source: Public Records
Mortgage History
| Date | Status | Borrower | Loan Amount |
|---|---|---|---|
| Closed | Bernier Diversified Holdings Llc | $31,385 |
Source: Public Records
Tax History Compared to Growth
Tax History
| Year | Tax Paid | Tax Assessment Tax Assessment Total Assessment is a certain percentage of the fair market value that is determined by local assessors to be the total taxable value of land and additions on the property. | Land | Improvement |
|---|---|---|---|---|
| 2024 | $705 | $25,248 | $3,018 | $22,230 |
| 2023 | $705 | $23,590 | $3,018 | $20,572 |
| 2022 | $423 | $12,503 | $3,018 | $9,485 |
| 2021 | $435 | $12,503 | $3,018 | $9,485 |
| 2020 | $444 | $12,503 | $3,018 | $9,485 |
| 2019 | $444 | $12,503 | $3,018 | $9,485 |
| 2018 | $450 | $12,503 | $3,018 | $9,485 |
| 2017 | $453 | $12,503 | $3,018 | $9,485 |
| 2016 | $527 | $14,588 | $3,018 | $11,570 |
| 2015 | -- | $14,588 | $3,018 | $11,570 |
| 2014 | $492 | $14,588 | $3,018 | $11,570 |
Source: Public Records
Map
Nearby Homes
- 2435 Muscogee Dr
- 2320 Barack Obama Blvd
- 2414 Deborah Dr
- 2310 Barack Obama Blvd
- 1507 Leone Ave
- 957 McAfina Trail
- 9 Oconee Place
- 1 Pomona Cir
- 2517 Deborah Dr
- 2745 Pineview Dr
- 904 Habersham Rd
- 1647 Fresno St
- 2202 Deborah Dr
- 2400 Lowndes Dr
- 1642 Lexington Cir
- 0 Northside Dr Unit 145194
- 2311 Lowndes Dr
- 2105 N Troup St
- 2713 Pineview Dr Unit A&B
- 1703 Largo Cir
- 2326 Sterling Place
- 2322 Sterling Place
- 2328 Sterling Place
- 2320 Sterling Place
- 2325 Diana Dr
- 2327 Diana Dr
- 2323 Diana Dr
- 2325 Sterling Place
- 2327 Sterling Place
- 2323 Sterling Place
- 2329 Diana Dr
- 2321 Diana Dr
- 2318 Sterling Place
- 2329 Sterling Place
- 2330 Sterling Place
- 2321 Sterling Place
- 2319 Diana Dr
- 1101 Pineview Dr
- 2331 Sterling Place
- 2319 Sterling Place