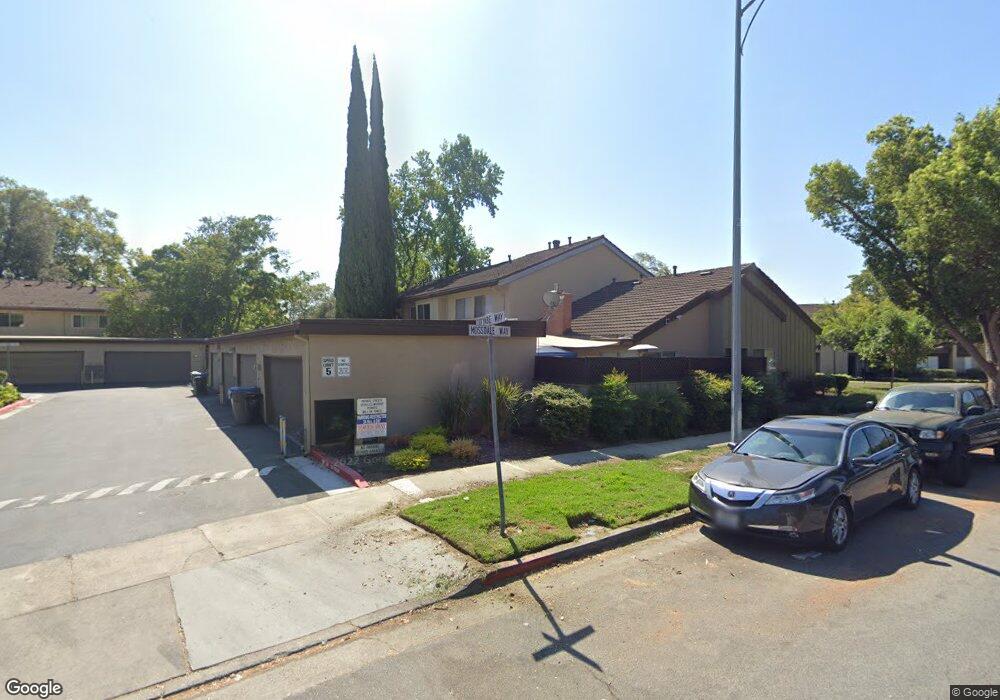
2324 Toiyabe Way San Jose, CA 95133
Commodore NeighborhoodEstimated Value: $798,000 - $850,931
4
Beds
3
Baths
1,596
Sq Ft
$511/Sq Ft
Est. Value
About This Home
This home is located at 2324 Toiyabe Way, San Jose, CA 95133 and is currently estimated at $815,233, approximately $510 per square foot. 2324 Toiyabe Way is a home located in Santa Clara County with nearby schools including Summerdale Elementary School, Piedmont Middle School, and Independence High School.
Ownership History
Date
Name
Owned For
Owner Type
Purchase Details
Closed on
Jul 18, 2025
Sold by
Flaugher April L
Bought by
Gianchandani Shivani Mahesh and Pamnani Yash
Current Estimated Value
Home Financials for this Owner
Home Financials are based on the most recent Mortgage that was taken out on this home.
Original Mortgage
$680,000
Outstanding Balance
$678,846
Interest Rate
6.84%
Mortgage Type
New Conventional
Estimated Equity
$136,387
Purchase Details
Closed on
Sep 28, 2005
Sold by
Flaugher David M
Bought by
Flaugher David M and Flaugher April L
Home Financials for this Owner
Home Financials are based on the most recent Mortgage that was taken out on this home.
Original Mortgage
$420,000
Interest Rate
2.37%
Mortgage Type
Negative Amortization
Purchase Details
Closed on
Sep 23, 2005
Sold by
Flaugher April Lynn
Bought by
Flaugher David M
Home Financials for this Owner
Home Financials are based on the most recent Mortgage that was taken out on this home.
Original Mortgage
$420,000
Interest Rate
2.37%
Mortgage Type
Negative Amortization
Create a Home Valuation Report for This Property
The Home Valuation Report is an in-depth analysis detailing your home's value as well as a comparison with similar homes in the area
Home Values in the Area
Average Home Value in this Area
Purchase History
| Date | Buyer | Sale Price | Title Company |
|---|---|---|---|
| Gianchandani Shivani Mahesh | $800,000 | Chicago Title | |
| Flaugher David M | -- | -- | |
| Flaugher David M | -- | Alliance Title Company |
Source: Public Records
Mortgage History
| Date | Status | Borrower | Loan Amount |
|---|---|---|---|
| Open | Gianchandani Shivani Mahesh | $680,000 | |
| Previous Owner | Flaugher David M | $420,000 |
Source: Public Records
Tax History Compared to Growth
Tax History
| Year | Tax Paid | Tax Assessment Tax Assessment Total Assessment is a certain percentage of the fair market value that is determined by local assessors to be the total taxable value of land and additions on the property. | Land | Improvement |
|---|---|---|---|---|
| 2025 | $4,250 | $226,233 | $67,917 | $158,316 |
| 2024 | $4,250 | $221,798 | $66,586 | $155,212 |
| 2023 | $4,250 | $217,450 | $65,281 | $152,169 |
| 2022 | $4,112 | $213,187 | $64,001 | $149,186 |
| 2021 | $3,946 | $209,008 | $62,747 | $146,261 |
| 2020 | $3,795 | $206,866 | $62,104 | $144,762 |
| 2019 | $3,643 | $202,811 | $60,887 | $141,924 |
| 2018 | $3,576 | $198,836 | $59,694 | $139,142 |
| 2017 | $3,574 | $194,938 | $58,524 | $136,414 |
| 2016 | $3,419 | $191,117 | $57,377 | $133,740 |
| 2015 | $3,371 | $188,248 | $56,516 | $131,732 |
| 2014 | $2,871 | $184,561 | $55,409 | $129,152 |
Source: Public Records
Map
Nearby Homes
- 2324 Mossdale Way
- 2328 Mossdale Way
- 832 N Jackson Ave
- 2369 Mabury Rd
- 1957 Cape Horn Dr
- 12280 Mabury Rd
- 1055 Thyme Walkway
- 1087 Yarrow Terrace
- 1049 Branbury Way
- 2109 Kiwi Walkway
- 709 Whitewater Ct Unit 44
- 985 Harcot Ct
- 990 Harcot Ct
- 1137 Mallow Terrace
- 970 E Harcot Ct
- 825 N Capitol Ave Unit 4
- 674 Galleon Ct
- 997 Harcot Ct
- 981 Harcot Ct
- 994 Harcot Ct
- 2326 Toiyabe Way
- 2322 Toiyabe Way
- 2328 Toiyabe Way
- 2320 Mossdale Way
- 2313 Meadowmont Dr
- 2317 Meadowmont Dr
- 2311 Meadowmont Dr
- 2309 Meadowmont Dr
- 2322 Mossdale Way
- 852 Toiyabe Ct
- 2305 Meadowmont Dr
- 854 Toiyabe Ct
- 2321 Meadowmont Dr
- 2319 Meadowmont Dr
- 858 Toiyabe Ct
- 856 Toiyabe Ct
- 2307 Meadowmont Dr
- 2323 Meadowmont Dr
- 2301 Meadowmont Dr
- 2326 Mossdale Way