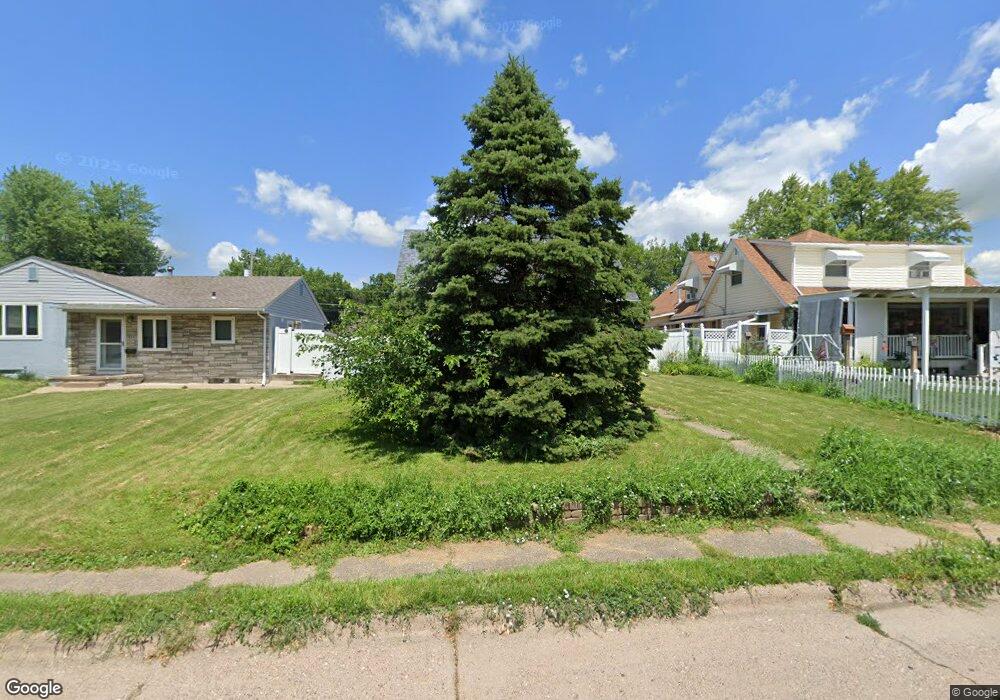
2324 W 10th St Davenport, IA 52804
West End NeighborhoodEstimated Value: $134,000 - $146,000
3
Beds
1
Bath
1,206
Sq Ft
$117/Sq Ft
Est. Value
About This Home
This home is located at 2324 W 10th St, Davenport, IA 52804 and is currently estimated at $140,859, approximately $116 per square foot. 2324 W 10th St is a home located in Scott County with nearby schools including Walnut Hill Elementary School, Wilson Elementary School, and Bluegrass Learning Academy.
Ownership History
Date
Name
Owned For
Owner Type
Purchase Details
Closed on
Oct 25, 2005
Sold by
Washburn Donald E and Washburn Hope E
Bought by
Washburn James Ross
Current Estimated Value
Create a Home Valuation Report for This Property
The Home Valuation Report is an in-depth analysis detailing your home's value as well as a comparison with similar homes in the area
Home Values in the Area
Average Home Value in this Area
Purchase History
| Date | Buyer | Sale Price | Title Company |
|---|---|---|---|
| Washburn James Ross | -- | None Available |
Source: Public Records
Tax History Compared to Growth
Tax History
| Year | Tax Paid | Tax Assessment Tax Assessment Total Assessment is a certain percentage of the fair market value that is determined by local assessors to be the total taxable value of land and additions on the property. | Land | Improvement |
|---|---|---|---|---|
| 2025 | $1,950 | $132,300 | $22,050 | $110,250 |
| 2024 | $1,898 | $119,330 | $22,050 | $97,280 |
| 2023 | $1,908 | $119,330 | $22,050 | $97,280 |
| 2022 | $1,838 | $98,210 | $19,600 | $78,610 |
| 2021 | $1,838 | $94,580 | $19,600 | $74,980 |
| 2020 | $1,720 | $88,750 | $19,600 | $69,150 |
| 2019 | $1,784 | $87,990 | $19,600 | $68,390 |
| 2018 | $1,662 | $87,990 | $19,600 | $68,390 |
| 2017 | $469 | $84,390 | $19,600 | $64,790 |
| 2016 | $1,658 | $84,390 | $0 | $0 |
| 2015 | $1,658 | $85,500 | $0 | $0 |
| 2014 | $1,706 | $85,500 | $0 | $0 |
| 2013 | $1,672 | $0 | $0 | $0 |
| 2012 | -- | $79,860 | $17,640 | $62,220 |
Source: Public Records
Map
Nearby Homes
- 926 Cimarron Dr
- 2449 W 13th St
- 1119 N Thornwood Ave
- 1203 N Thornwood Ave
- 1230 N Elmwood Ave
- 809 Cimarron Dr
- 2114 Telegraph Rd
- 2024 W 6th St
- 511 Waverly Rd
- 1854 W 8th St
- 1110 Hillandale Rd
- 2417 W 18th St
- 2102 W 17th St
- 2243 W 4th St
- 1824 W 8th St
- 321 Cedar St
- 1922 N Pine St
- 3117 Schuetzen Ln
- 625 N Division St
- 1419 N Division St