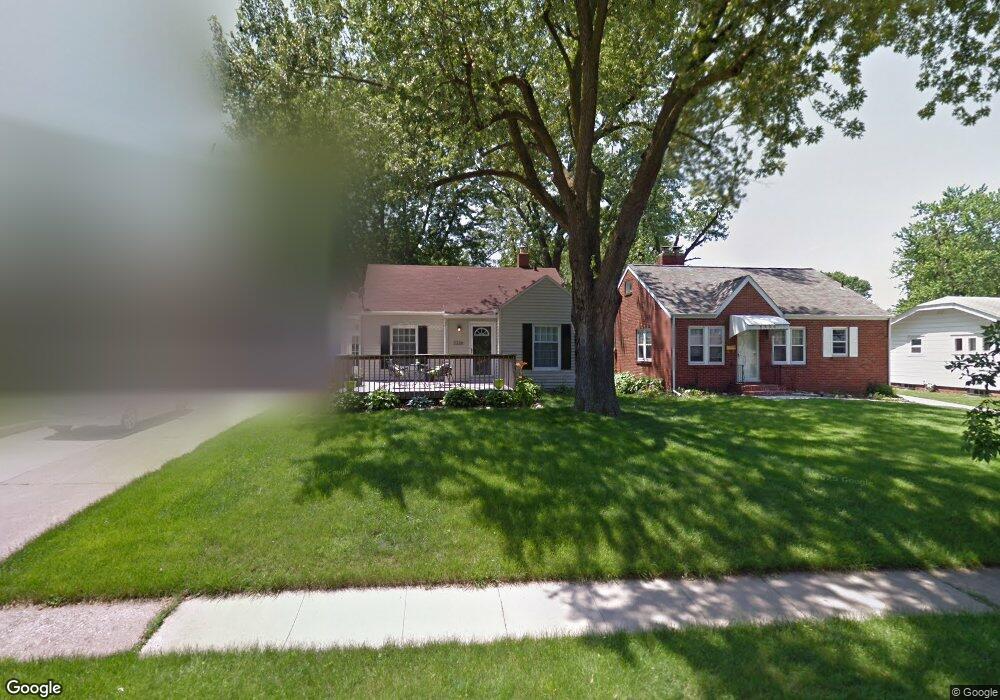
2326 35th St Des Moines, IA 50310
Beaverdale NeighborhoodEstimated Value: $221,714 - $229,000
2
Beds
2
Baths
1,056
Sq Ft
$214/Sq Ft
Est. Value
About This Home
This home is located at 2326 35th St, Des Moines, IA 50310 and is currently estimated at $225,929, approximately $213 per square foot. 2326 35th St is a home located in Polk County with nearby schools including Monroe Elementary School, Meredith Middle School, and Hoover High School.
Ownership History
Date
Name
Owned For
Owner Type
Purchase Details
Closed on
Apr 29, 2008
Sold by
Acton Thomas and Acton Jennifer D
Bought by
Mcmaster Jacque
Current Estimated Value
Home Financials for this Owner
Home Financials are based on the most recent Mortgage that was taken out on this home.
Original Mortgage
$122,000
Interest Rate
5.88%
Mortgage Type
Purchase Money Mortgage
Purchase Details
Closed on
Apr 21, 1999
Sold by
Guy Gary A and Guy Dawn M
Bought by
Dean Jennifer D
Home Financials for this Owner
Home Financials are based on the most recent Mortgage that was taken out on this home.
Original Mortgage
$79,652
Interest Rate
7.17%
Mortgage Type
FHA
Purchase Details
Closed on
Feb 18, 1998
Sold by
Jackson Jay E and Jackson Sidney
Bought by
Guy Gary A and Guy Dawn M
Home Financials for this Owner
Home Financials are based on the most recent Mortgage that was taken out on this home.
Original Mortgage
$77,100
Interest Rate
6.99%
Create a Home Valuation Report for This Property
The Home Valuation Report is an in-depth analysis detailing your home's value as well as a comparison with similar homes in the area
Home Values in the Area
Average Home Value in this Area
Purchase History
| Date | Buyer | Sale Price | Title Company |
|---|---|---|---|
| Mcmaster Jacque | $121,500 | None Available | |
| Dean Jennifer D | $81,500 | -- | |
| Guy Gary A | $67,500 | -- |
Source: Public Records
Mortgage History
| Date | Status | Borrower | Loan Amount |
|---|---|---|---|
| Previous Owner | Mcmaster Jacque | $122,000 | |
| Previous Owner | Dean Jennifer D | $79,652 | |
| Previous Owner | Guy Gary A | $77,100 |
Source: Public Records
Tax History Compared to Growth
Tax History
| Year | Tax Paid | Tax Assessment Tax Assessment Total Assessment is a certain percentage of the fair market value that is determined by local assessors to be the total taxable value of land and additions on the property. | Land | Improvement |
|---|---|---|---|---|
| 2025 | $3,598 | $210,000 | $40,000 | $170,000 |
| 2024 | $3,598 | $193,400 | $36,200 | $157,200 |
| 2023 | $3,626 | $193,400 | $36,200 | $157,200 |
| 2022 | $3,596 | $162,700 | $31,300 | $131,400 |
| 2021 | $3,526 | $162,700 | $31,300 | $131,400 |
| 2020 | $3,658 | $149,900 | $28,700 | $121,200 |
| 2019 | $3,358 | $149,900 | $28,700 | $121,200 |
| 2018 | $3,320 | $133,500 | $25,100 | $108,400 |
| 2017 | $3,056 | $133,500 | $25,100 | $108,400 |
| 2016 | $2,972 | $121,500 | $22,400 | $99,100 |
| 2015 | $2,972 | $121,500 | $22,400 | $99,100 |
| 2014 | $2,958 | $120,000 | $21,700 | $98,300 |
Source: Public Records
Map
Nearby Homes