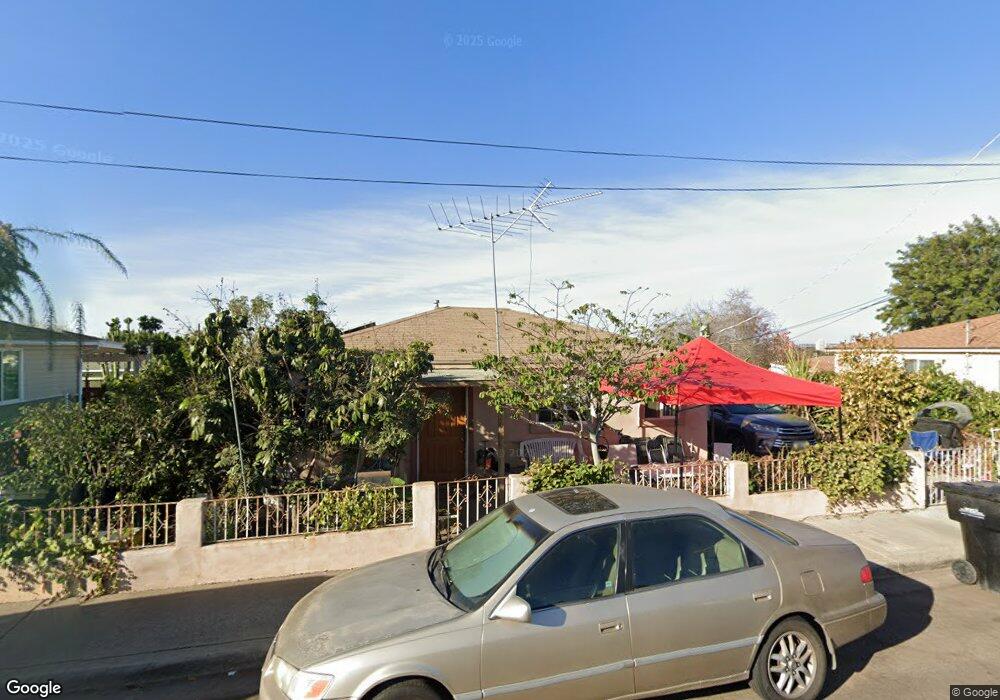
2326 Comstock St San Diego, CA 92111
Linda Vista NeighborhoodEstimated Value: $772,000 - $925,000
3
Beds
2
Baths
966
Sq Ft
$898/Sq Ft
Est. Value
About This Home
This home is located at 2326 Comstock St, San Diego, CA 92111 and is currently estimated at $867,574, approximately $898 per square foot. 2326 Comstock St is a home located in San Diego County with nearby schools including Linda Vista Elementary School, Montgomery Middle School, and San Diego Cooperative Charter School.
Ownership History
Date
Name
Owned For
Owner Type
Purchase Details
Closed on
Jun 3, 2015
Sold by
Nguyen Truong
Bought by
Nguyen Truong Tuyen
Current Estimated Value
Purchase Details
Closed on
Jun 23, 2008
Sold by
Hsbc Bank Usa Na
Bought by
Nguyen Truong
Home Financials for this Owner
Home Financials are based on the most recent Mortgage that was taken out on this home.
Original Mortgage
$185,500
Outstanding Balance
$121,206
Interest Rate
6.41%
Mortgage Type
Purchase Money Mortgage
Estimated Equity
$746,368
Purchase Details
Closed on
Jan 2, 2008
Sold by
Cesena Anna
Bought by
Hsbc Bank Usa Na
Purchase Details
Closed on
Jun 29, 2005
Sold by
Ruiz Jesus V
Bought by
Cesena Anna
Home Financials for this Owner
Home Financials are based on the most recent Mortgage that was taken out on this home.
Original Mortgage
$86,000
Interest Rate
5.61%
Mortgage Type
Credit Line Revolving
Create a Home Valuation Report for This Property
The Home Valuation Report is an in-depth analysis detailing your home's value as well as a comparison with similar homes in the area
Home Values in the Area
Average Home Value in this Area
Purchase History
| Date | Buyer | Sale Price | Title Company |
|---|---|---|---|
| Nguyen Truong Tuyen | -- | None Available | |
| Nguyen Truong | $265,000 | First American Title Company | |
| Hsbc Bank Usa Na | $296,250 | Accommodation | |
| Cesena Anna | $445,000 | Fidelity National Title San |
Source: Public Records
Mortgage History
| Date | Status | Borrower | Loan Amount |
|---|---|---|---|
| Open | Nguyen Truong | $185,500 | |
| Previous Owner | Cesena Anna | $86,000 | |
| Previous Owner | Cesena Anna | $344,000 |
Source: Public Records
Tax History Compared to Growth
Tax History
| Year | Tax Paid | Tax Assessment Tax Assessment Total Assessment is a certain percentage of the fair market value that is determined by local assessors to be the total taxable value of land and additions on the property. | Land | Improvement |
|---|---|---|---|---|
| 2025 | $4,334 | $361,199 | $289,739 | $71,460 |
| 2024 | $4,334 | $354,117 | $284,058 | $70,059 |
| 2023 | $4,237 | $347,175 | $278,489 | $68,686 |
| 2022 | $4,122 | $340,369 | $273,029 | $67,340 |
| 2021 | $4,088 | $333,696 | $267,676 | $66,020 |
| 2020 | $4,035 | $330,276 | $264,932 | $65,344 |
| 2019 | $3,959 | $323,801 | $259,738 | $64,063 |
| 2018 | $3,702 | $317,453 | $254,646 | $62,807 |
| 2017 | $3,613 | $311,229 | $249,653 | $61,576 |
| 2016 | $3,549 | $305,127 | $244,758 | $60,369 |
| 2015 | $3,496 | $300,545 | $241,082 | $59,463 |
| 2014 | -- | $294,659 | $236,360 | $58,299 |
Source: Public Records
Map
Nearby Homes
- 6736 Kelly St
- 6492 Lanston St
- 6737 Thomson Ct
- 6728 Thomson Ct
- 2005 Burton St Unit 1
- 2037 Burton St Unit 43
- 2201-7 Burroughs St
- 2525 Inman Ct
- 2249-51 W Dunlop St
- 2675 Comstock St
- 7128 E Hyatt St
- 6338 Caminito Del Pastel Unit 148
- 6340 Caminito Del Pastel Unit 147
- 2216-18 Dunlop St
- 6426 Caminito Listo
- 6422 Caminito Listo
- 1948 Westinghouse St
- 6317 Caminito Del Pastel
- 6328-30 Quillan St
- 1892 Westinghouse St
- 2316 Comstock St
- 2336 Comstock St Unit 38
- 2303 Langmuir St Unit 5
- 2306 Comstock St
- 2265 Langmuir St
- 2325 Comstock St
- 2315 Langmuir St Unit 17
- 2315 Comstock St
- 2335 Comstock St Unit 37
- 2251 Langmuir St Unit 55
- 2305 Comstock St
- 2346 Comstock St Unit 48
- 2296 Comstock St Unit 2302
- 23352337 Langmuir St
- 2325 Langmuir St Unit 29
- 2345 Comstock St Unit 47
- 2295 Comstock St Unit 97
- 2324 W Jewett St Unit 28
- 2306 Langmuir St Unit 8
- 2336 W Jewett St