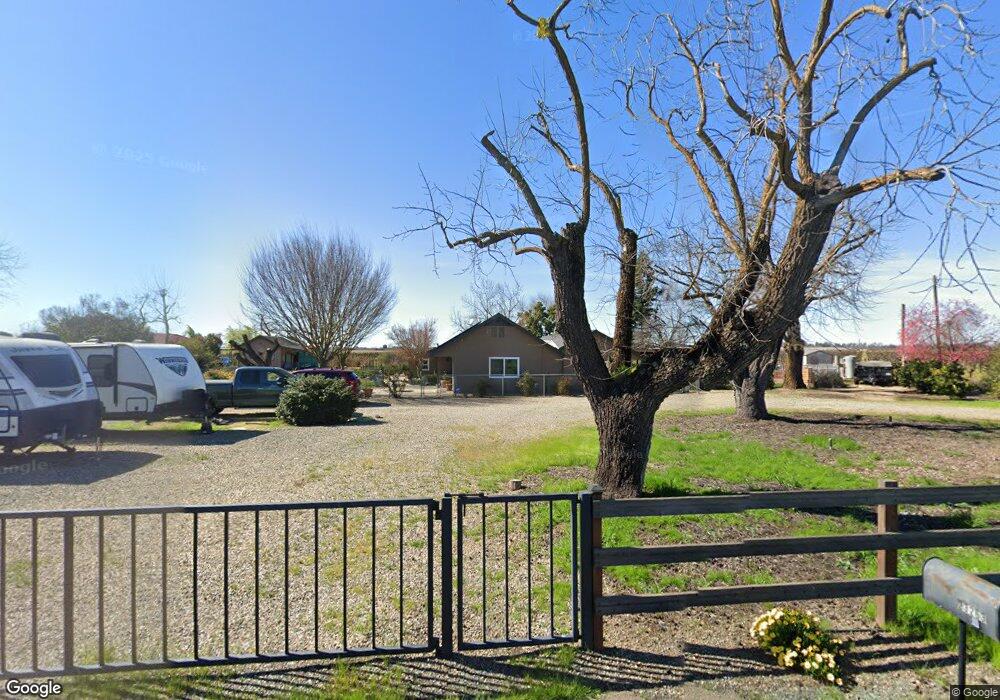
23263 N Dustin Rd Acampo, CA 95220
Estimated Value: $684,000 - $888,000
3
Beds
2
Baths
2,273
Sq Ft
$332/Sq Ft
Est. Value
About This Home
This home is located at 23263 N Dustin Rd, Acampo, CA 95220 and is currently estimated at $755,160, approximately $332 per square foot. 23263 N Dustin Rd is a home located in San Joaquin County with nearby schools including Oak View Elementary School and Galt High School.
Ownership History
Date
Name
Owned For
Owner Type
Purchase Details
Closed on
Apr 25, 2012
Sold by
Oborn Jeff J and Oborn Kristi
Bought by
Steele Oborn Kristi and Oborn Jeffrey
Current Estimated Value
Home Financials for this Owner
Home Financials are based on the most recent Mortgage that was taken out on this home.
Original Mortgage
$417,000
Outstanding Balance
$287,890
Interest Rate
3.9%
Mortgage Type
New Conventional
Estimated Equity
$467,270
Purchase Details
Closed on
Nov 25, 1997
Sold by
Zunino John B and Zunino Coby M
Bought by
Oborn Jeff J and Oborn Kristi
Home Financials for this Owner
Home Financials are based on the most recent Mortgage that was taken out on this home.
Original Mortgage
$150,000
Interest Rate
7.19%
Mortgage Type
VA
Purchase Details
Closed on
Feb 2, 1994
Sold by
Troutman David A and Zunino John B
Bought by
Zunino John B and Zunino Coby M
Create a Home Valuation Report for This Property
The Home Valuation Report is an in-depth analysis detailing your home's value as well as a comparison with similar homes in the area
Purchase History
| Date | Buyer | Sale Price | Title Company |
|---|---|---|---|
| Steele Oborn Kristi | -- | Old Republic Title Company | |
| Oborn Jeff J | $150,000 | Central Valley Title Company | |
| Zunino John B | $126,477 | Old Republic Title Company |
Source: Public Records
Mortgage History
| Date | Status | Borrower | Loan Amount |
|---|---|---|---|
| Open | Steele Oborn Kristi | $417,000 | |
| Closed | Oborn Jeff J | $150,000 |
Source: Public Records
Tax History
| Year | Tax Paid | Tax Assessment Tax Assessment Total Assessment is a certain percentage of the fair market value that is determined by local assessors to be the total taxable value of land and additions on the property. | Land | Improvement |
|---|---|---|---|---|
| 2025 | $2,740 | $252,038 | $103,780 | $148,258 |
| 2024 | $2,687 | $247,097 | $101,746 | $145,351 |
| 2023 | $2,650 | $242,252 | $99,751 | $142,501 |
| 2022 | $2,533 | $237,503 | $97,796 | $139,707 |
| 2021 | $2,527 | $232,847 | $95,879 | $136,968 |
| 2020 | $2,503 | $230,460 | $94,896 | $135,564 |
| 2019 | $2,443 | $225,942 | $93,036 | $132,906 |
| 2018 | $2,429 | $221,512 | $91,212 | $130,300 |
| 2017 | $2,338 | $217,170 | $89,424 | $127,746 |
| 2016 | $2,305 | $212,912 | $87,671 | $125,241 |
| 2014 | $2,214 | $205,607 | $84,663 | $120,944 |
Source: Public Records
Map
Nearby Homes
- 11501 E Jahant Rd
- 22135 Bruella Rd
- 5712 E Jahant Rd
- 21863 N Bruella Rd
- 5420 E Jahant Rd
- 11153 E Peltier Rd
- 21428 N Dutchess Ln
- 21324 N Dutchess Ln
- 21376 N Dutchess Ln
- 25393 Kennefick Rd
- 8275 E Orchard Rd Unit E
- 3454 E Peltier Rd
- 20388 N State Route 99 E Fron
- 21167 N Tretheway Rd
- 19690 N Highway 99 Unit 26
- 19690 N Highway 99 Unit 7
- 19690 N Highway 99 Unit 8
- 19690 N Highway 99 Unit 18
- 19690 N Highway 99 Unit 162
- 19690 California 99 Unit 110
- 23233 N Dustin Rd
- 23361 N Dustin Rd
- 23324 N Dustin Rd
- 23145 N Dustin Rd
- 23100 N Dustin Rd
- 23200 N Dustin Rd
- 23457 N Dustin Rd
- 23090 N Dustin Rd
- 23500 N Dustin Rd
- 23192 N Dustin Rd
- 23562 N Dustin Rd
- 22999 N Dustin Rd
- 23569 N Dustin Rd
- 23590 N Dustin Rd
- 22912 N Dustin Rd
- 23660 N Dustin Rd
- 23632 N Dustin Rd
- 22891 N Dustin Rd
- 23668 N Dustin Rd
- 23670 N Dustin Rd
Your Personal Tour Guide
Ask me questions while you tour the home.