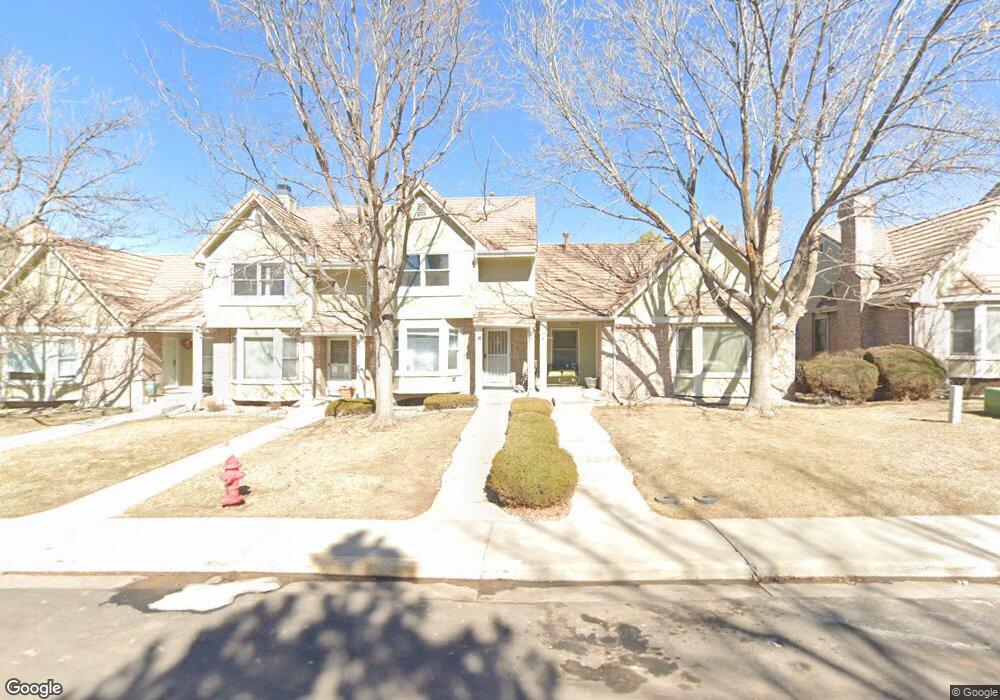
2327 Ranch Dr Denver, CO 80234
The Ranch NeighborhoodEstimated Value: $455,000 - $484,000
3
Beds
4
Baths
2,178
Sq Ft
$217/Sq Ft
Est. Value
About This Home
This home is located at 2327 Ranch Dr, Denver, CO 80234 and is currently estimated at $473,460, approximately $217 per square foot. 2327 Ranch Dr is a home located in Adams County with nearby schools including Cotton Creek Elementary School, Silver Hills Middle School, and Mountain Range High School.
Ownership History
Date
Name
Owned For
Owner Type
Purchase Details
Closed on
Dec 30, 2019
Sold by
Sanfilippo Joseph
Bought by
Hernandez Lidia and Hernandez Jose Santana
Current Estimated Value
Home Financials for this Owner
Home Financials are based on the most recent Mortgage that was taken out on this home.
Original Mortgage
$333,743
Outstanding Balance
$299,774
Interest Rate
4.5%
Mortgage Type
FHA
Estimated Equity
$173,686
Purchase Details
Closed on
Jun 30, 2015
Sold by
Sanfilippo Charles G and Sanfilippo Shirley M
Bought by
Sanfilippo Joseph
Home Financials for this Owner
Home Financials are based on the most recent Mortgage that was taken out on this home.
Original Mortgage
$162,000
Interest Rate
3.9%
Mortgage Type
New Conventional
Purchase Details
Closed on
May 15, 2007
Sold by
Thissen Martin J
Bought by
Sanfilippo Charles G and Sanfilippo Shirley M
Purchase Details
Closed on
Dec 10, 1998
Sold by
Berger Michael A
Bought by
Thissen Martin J
Create a Home Valuation Report for This Property
The Home Valuation Report is an in-depth analysis detailing your home's value as well as a comparison with similar homes in the area
Home Values in the Area
Average Home Value in this Area
Purchase History
| Date | Buyer | Sale Price | Title Company |
|---|---|---|---|
| Hernandez Lidia | $339,900 | Fidelity National Title | |
| Sanfilippo Joseph | $180,000 | Land Title Guarantee Company | |
| Sanfilippo Charles G | $180,000 | Landamerica | |
| Thissen Martin J | $159,000 | Land Title |
Source: Public Records
Mortgage History
| Date | Status | Borrower | Loan Amount |
|---|---|---|---|
| Open | Hernandez Lidia | $333,743 | |
| Previous Owner | Sanfilippo Joseph | $162,000 |
Source: Public Records
Tax History Compared to Growth
Tax History
| Year | Tax Paid | Tax Assessment Tax Assessment Total Assessment is a certain percentage of the fair market value that is determined by local assessors to be the total taxable value of land and additions on the property. | Land | Improvement |
|---|---|---|---|---|
| 2024 | $2,983 | $31,500 | $6,250 | $25,250 |
| 2023 | $2,951 | $34,030 | $5,680 | $28,350 |
| 2022 | $2,773 | $25,550 | $4,870 | $20,680 |
| 2021 | $2,773 | $25,550 | $4,870 | $20,680 |
| 2020 | $2,735 | $25,690 | $5,010 | $20,680 |
| 2019 | $2,609 | $24,460 | $5,010 | $19,450 |
| 2018 | $2,353 | $21,340 | $2,230 | $19,110 |
| 2017 | $2,123 | $21,340 | $2,230 | $19,110 |
| 2016 | $1,906 | $18,580 | $2,470 | $16,110 |
| 2015 | $1,904 | $18,580 | $2,470 | $16,110 |
| 2014 | -- | $14,790 | $2,470 | $12,320 |
Source: Public Records
Map
Nearby Homes
- 11183 Alcott St Unit D
- 11351 Quivas Way
- 1665 W 113th Ave
- 11172 Bryant Ct
- 2421 Ranch Reserve Ridge
- 11210 Quivas Loop
- 2681 Ranch Reserve Ridge
- 2562 W 110th Ave
- 11242 Osage Cir Unit B
- 11485 Pecos St
- 2556 W 110th Place
- 11207 Osage Cir Unit B
- 11016 Clay Dr
- 11163 Navajo St
- 2502 W 108th Place
- 2885 W 115th Dr
- 1283 W 112th Ave Unit B
- 3074 W 113th Ct Unit D
- 10793 Alcott Way
- 2363 W 118th Ave