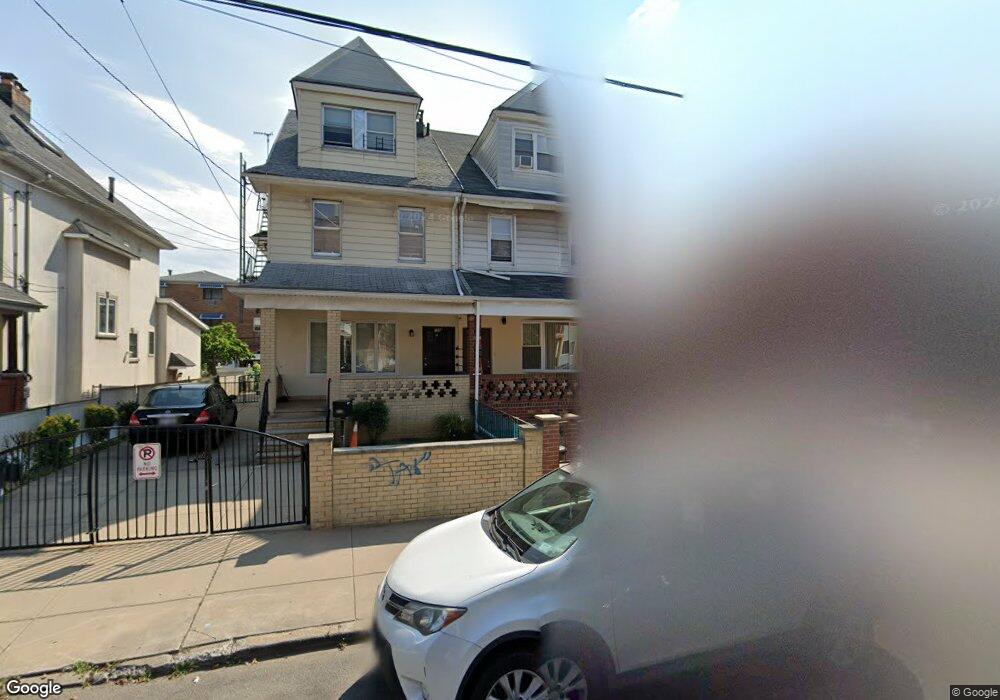
2328 83rd St Brooklyn, NY 11214
Gravesend NeighborhoodEstimated Value: $1,578,000 - $1,790,782
--
Bed
--
Bath
2,621
Sq Ft
$650/Sq Ft
Est. Value
About This Home
This home is located at 2328 83rd St, Brooklyn, NY 11214 and is currently estimated at $1,704,946, approximately $650 per square foot. 2328 83rd St is a home located in Kings County with nearby schools including P.S. 97 - The Highlawn, Seth Low Intermediate School 96, and Hebrew Language Academy Charter 2.
Ownership History
Date
Name
Owned For
Owner Type
Purchase Details
Closed on
Nov 13, 2014
Sold by
D'Addone Loretta
Bought by
Cao Rong
Current Estimated Value
Home Financials for this Owner
Home Financials are based on the most recent Mortgage that was taken out on this home.
Original Mortgage
$450,000
Outstanding Balance
$344,970
Interest Rate
4.02%
Mortgage Type
New Conventional
Estimated Equity
$1,359,976
Purchase Details
Closed on
Jan 28, 2002
Sold by
Giarraffa Domenick P
Bought by
Giarraffa Robert and D'Addone Loretta
Create a Home Valuation Report for This Property
The Home Valuation Report is an in-depth analysis detailing your home's value as well as a comparison with similar homes in the area
Home Values in the Area
Average Home Value in this Area
Purchase History
| Date | Buyer | Sale Price | Title Company |
|---|---|---|---|
| Cao Rong | $850,000 | -- | |
| Giarraffa Robert | -- | -- | |
| Faviano Rose M | -- | -- |
Source: Public Records
Mortgage History
| Date | Status | Borrower | Loan Amount |
|---|---|---|---|
| Open | Cao Rong | $450,000 |
Source: Public Records
Tax History Compared to Growth
Tax History
| Year | Tax Paid | Tax Assessment Tax Assessment Total Assessment is a certain percentage of the fair market value that is determined by local assessors to be the total taxable value of land and additions on the property. | Land | Improvement |
|---|---|---|---|---|
| 2025 | $10,127 | $119,160 | $16,140 | $103,020 |
| 2024 | $10,127 | $94,140 | $16,140 | $78,000 |
| 2023 | $9,803 | $97,320 | $16,140 | $81,180 |
| 2022 | $7,227 | $88,380 | $16,140 | $72,240 |
| 2021 | $9,724 | $84,240 | $16,140 | $68,100 |
| 2020 | $4,608 | $80,160 | $16,140 | $64,020 |
| 2019 | $8,790 | $80,160 | $16,140 | $64,020 |
| 2018 | $8,200 | $40,225 | $8,622 | $31,603 |
| 2017 | $8,200 | $40,225 | $11,190 | $29,035 |
| 2016 | $6,368 | $31,856 | $8,312 | $23,544 |
| 2015 | $3,569 | $30,057 | $11,763 | $18,294 |
| 2014 | $3,569 | $28,365 | $11,101 | $17,264 |
Source: Public Records
Map
Nearby Homes