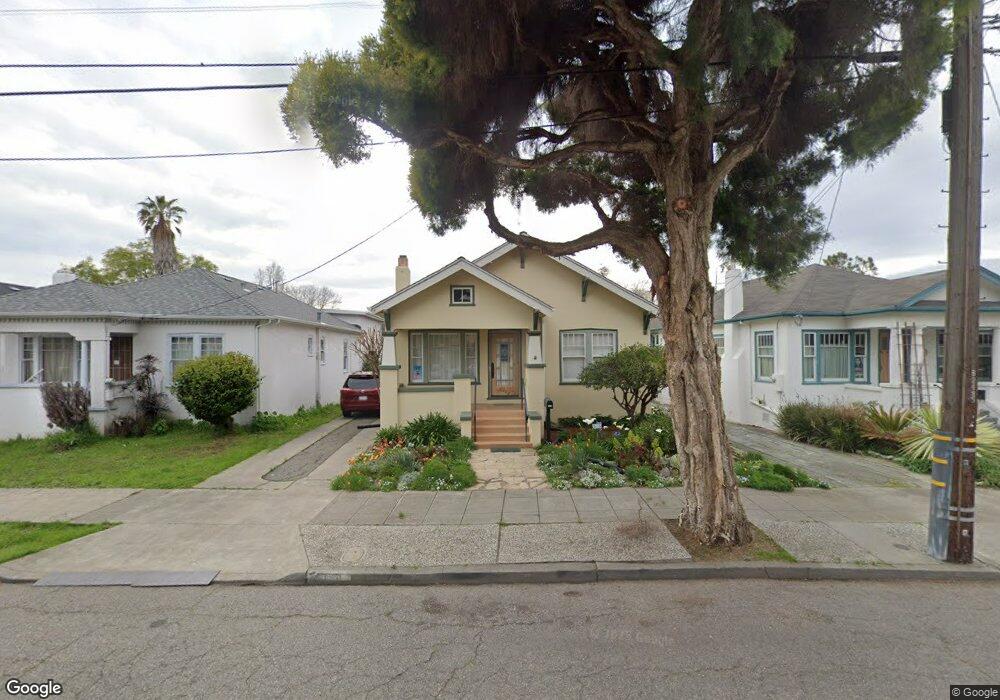
2328 Jefferson Ave Berkeley, CA 94703
Downtown Berkeley NeighborhoodEstimated Value: $997,000 - $1,175,403
2
Beds
1
Bath
1,215
Sq Ft
$912/Sq Ft
Est. Value
About This Home
This home is located at 2328 Jefferson Ave, Berkeley, CA 94703 and is currently estimated at $1,107,601, approximately $911 per square foot. 2328 Jefferson Ave is a home located in Alameda County with nearby schools including Washington Elementary School, Oxford Elementary School, and Berkeley Arts Magnet at Whittier School.
Ownership History
Date
Name
Owned For
Owner Type
Purchase Details
Closed on
Dec 11, 2019
Sold by
Macneill Deborah A
Bought by
Macneill Deborah A and Deborah A Macneil Revocable Tr
Current Estimated Value
Purchase Details
Closed on
May 1, 2009
Sold by
Carpenter Anne E
Bought by
Macneill Deborah A
Purchase Details
Closed on
May 15, 1997
Sold by
Lackey Seamus
Bought by
Carpenter Anne E and Macneill Deborah A
Home Financials for this Owner
Home Financials are based on the most recent Mortgage that was taken out on this home.
Original Mortgage
$190,800
Outstanding Balance
$26,472
Interest Rate
8.15%
Estimated Equity
$1,081,129
Purchase Details
Closed on
Aug 2, 1996
Sold by
Lackey Deborah and Segal Deborah
Bought by
Lackey Seamus
Purchase Details
Closed on
Dec 25, 1993
Sold by
Lackey Seamus
Bought by
Lackey Seamus and Lackey Deborah
Create a Home Valuation Report for This Property
The Home Valuation Report is an in-depth analysis detailing your home's value as well as a comparison with similar homes in the area
Home Values in the Area
Average Home Value in this Area
Purchase History
| Date | Buyer | Sale Price | Title Company |
|---|---|---|---|
| Macneill Deborah A | -- | None Available | |
| Macneill Deborah A | -- | None Available | |
| Carpenter Anne E | $238,500 | Old Republic Title Company | |
| Lackey Seamus | -- | -- | |
| Lackey Seamus | -- | -- |
Source: Public Records
Mortgage History
| Date | Status | Borrower | Loan Amount |
|---|---|---|---|
| Open | Carpenter Anne E | $190,800 |
Source: Public Records
Tax History
| Year | Tax Paid | Tax Assessment Tax Assessment Total Assessment is a certain percentage of the fair market value that is determined by local assessors to be the total taxable value of land and additions on the property. | Land | Improvement |
|---|---|---|---|---|
| 2025 | $8,895 | $381,418 | $116,607 | $271,811 |
| 2024 | $8,895 | $373,802 | $114,320 | $266,482 |
| 2023 | $8,632 | $373,337 | $112,079 | $261,258 |
| 2022 | $8,581 | $359,018 | $109,882 | $256,136 |
| 2021 | $8,564 | $351,841 | $107,727 | $251,114 |
| 2020 | $8,044 | $355,163 | $106,623 | $248,540 |
| 2019 | $7,640 | $348,201 | $104,533 | $243,668 |
| 2018 | $7,457 | $341,376 | $102,484 | $238,892 |
| 2017 | $7,178 | $334,684 | $100,475 | $234,209 |
| 2016 | $6,856 | $328,122 | $98,505 | $229,617 |
| 2015 | $6,735 | $323,195 | $97,026 | $226,169 |
| 2014 | $6,584 | $316,866 | $95,126 | $221,740 |
Source: Public Records
Map
Nearby Homes
- 2350 Sacramento St
- 1604 Dwight Way
- 2304 Edwards St
- 2118 California St
- 1634 Blake St
- 1524 Blake St
- 2437 Acton St
- 2218 -2222 Grant St
- 1612 Parker St
- 2533 Grant St
- 1515 Derby St
- 1819 Carleton St
- 1901 Parker St Unit 3
- 2701 Grant St
- 1512 Hearst Ave Unit 1512
- 2324 Browning St
- 1813 Sacramento St
- 2750 Sacramento St
- 1411 Hearst Ave Unit 2
- 1450 Ward St
- 2330 Jefferson Ave
- 2324 Jefferson Ave
- 2332 Jefferson Ave
- 2320 Jefferson Ave
- 2334 Jefferson Ave
- 2316 Jefferson Ave
- 2321 California St
- 2319 California St
- 2325 California St
- 2336 Jefferson Ave
- 2315 California St
- 2310 Jefferson Ave
- 2329 California St
- 2311 California St
- 2308 Jefferson Ave
- 2338 Jefferson Ave
- 2335 California St
- 2323 Jefferson Ave
- 2325 Jefferson Ave
- 2309 California St
Your Personal Tour Guide
Ask me questions while you tour the home.