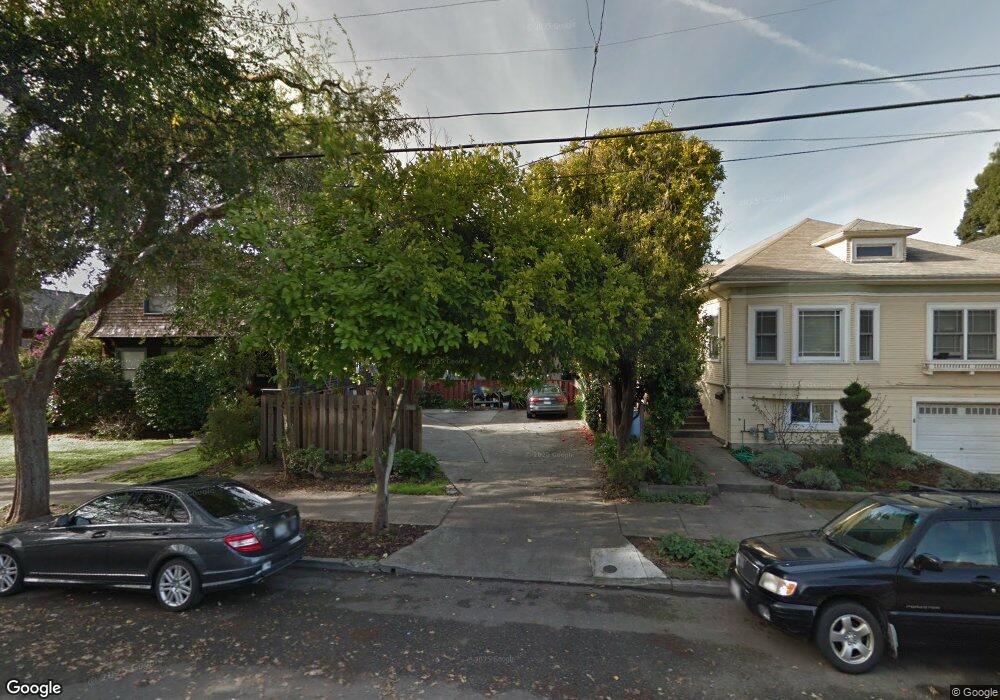
2328 Roosevelt Ave Berkeley, CA 94703
Downtown Berkeley NeighborhoodEstimated Value: $948,687 - $1,380,000
5
Beds
4
Baths
2,964
Sq Ft
$384/Sq Ft
Est. Value
About This Home
This home is located at 2328 Roosevelt Ave, Berkeley, CA 94703 and is currently estimated at $1,137,422, approximately $383 per square foot. 2328 Roosevelt Ave is a home located in Alameda County with nearby schools including Washington Elementary School, Berkeley Arts Magnet at Whittier School, and Oxford Elementary School.
Ownership History
Date
Name
Owned For
Owner Type
Purchase Details
Closed on
May 25, 2016
Sold by
Chen Joseph D and Chen Tien Min W
Bought by
Yamamoto Michael K and Yamamoto Dorothy C
Current Estimated Value
Home Financials for this Owner
Home Financials are based on the most recent Mortgage that was taken out on this home.
Original Mortgage
$488,000
Outstanding Balance
$388,482
Interest Rate
3.66%
Mortgage Type
New Conventional
Estimated Equity
$748,940
Purchase Details
Closed on
Jan 28, 2013
Sold by
Leung Bill and Yung Sau Hing Leung Revocable
Bought by
Chen Joseph D and Chen Tien Min W
Home Financials for this Owner
Home Financials are based on the most recent Mortgage that was taken out on this home.
Original Mortgage
$382,500
Interest Rate
3.33%
Mortgage Type
New Conventional
Purchase Details
Closed on
Nov 2, 2001
Sold by
Leung Yung San Hing and Leung Yung Sau Hing
Bought by
Leung Yung Sau Hing and Yung Sau Hing Leung Revocable
Create a Home Valuation Report for This Property
The Home Valuation Report is an in-depth analysis detailing your home's value as well as a comparison with similar homes in the area
Home Values in the Area
Average Home Value in this Area
Purchase History
| Date | Buyer | Sale Price | Title Company |
|---|---|---|---|
| Yamamoto Michael K | $620,000 | Fidelity National Title Co | |
| Chen Joseph D | $510,000 | Placer Title Company | |
| Leung Yung Sau Hing | -- | -- |
Source: Public Records
Mortgage History
| Date | Status | Borrower | Loan Amount |
|---|---|---|---|
| Open | Yamamoto Michael K | $488,000 | |
| Previous Owner | Chen Joseph D | $382,500 |
Source: Public Records
Tax History
| Year | Tax Paid | Tax Assessment Tax Assessment Total Assessment is a certain percentage of the fair market value that is determined by local assessors to be the total taxable value of land and additions on the property. | Land | Improvement |
|---|---|---|---|---|
| 2025 | $12,484 | $628,003 | $188,401 | $439,602 |
| 2024 | $12,484 | $615,691 | $184,707 | $430,984 |
| 2023 | $12,197 | $603,620 | $181,086 | $422,534 |
| 2022 | $11,911 | $591,788 | $177,536 | $414,252 |
| 2021 | $11,894 | $580,185 | $174,055 | $406,130 |
| 2020 | $11,079 | $574,238 | $172,271 | $401,967 |
| 2019 | $10,452 | $562,983 | $168,895 | $394,088 |
| 2018 | $10,239 | $551,947 | $165,584 | $386,363 |
| 2017 | $9,865 | $541,124 | $162,337 | $378,787 |
| 2016 | $9,426 | $530,517 | $159,155 | $371,362 |
| 2015 | $9,284 | $522,550 | $156,765 | $365,785 |
| 2014 | $9,349 | $512,314 | $153,694 | $358,620 |
Source: Public Records
Map
Nearby Homes
- 2218 -2222 Grant St
- 1604 Dwight Way
- 1634 Blake St
- 2533 Grant St
- 2118 California St
- 2350 Sacramento St
- 1524 Blake St
- 1612 Parker St
- 1901 Parker St Unit 3
- 2304 Edwards St
- 1819 Carleton St
- 2437 Acton St
- 2701 Grant St
- 1515 Derby St
- 1512 Hearst Ave Unit 1512
- 1813 Sacramento St
- 2750 Sacramento St
- 1411 Hearst Ave Unit 2
- 1450 Ward St
- 1436 Delaware St
- 2326 Roosevelt Ave
- 2330 Roosevelt Ave
- 2324 Roosevelt Ave
- 2334 Roosevelt Ave
- 2322 Roosevelt Ave
- 2325 McGee Ave
- 2329 McGee Ave
- 2323 McGee Ave
- 2338 Roosevelt Ave
- 2331 McGee Ave
- 2312 Roosevelt Ave
- 2319 McGee Ave
- 2333 McGee Ave
- 2340 Roosevelt Ave
- 2329 Roosevelt Ave
- 2325 Roosevelt Ave
- 2315 McGee Ave
- 2339 McGee Ave
- 2331 Roosevelt Ave
- 2319 Roosevelt Ave
Your Personal Tour Guide
Ask me questions while you tour the home.