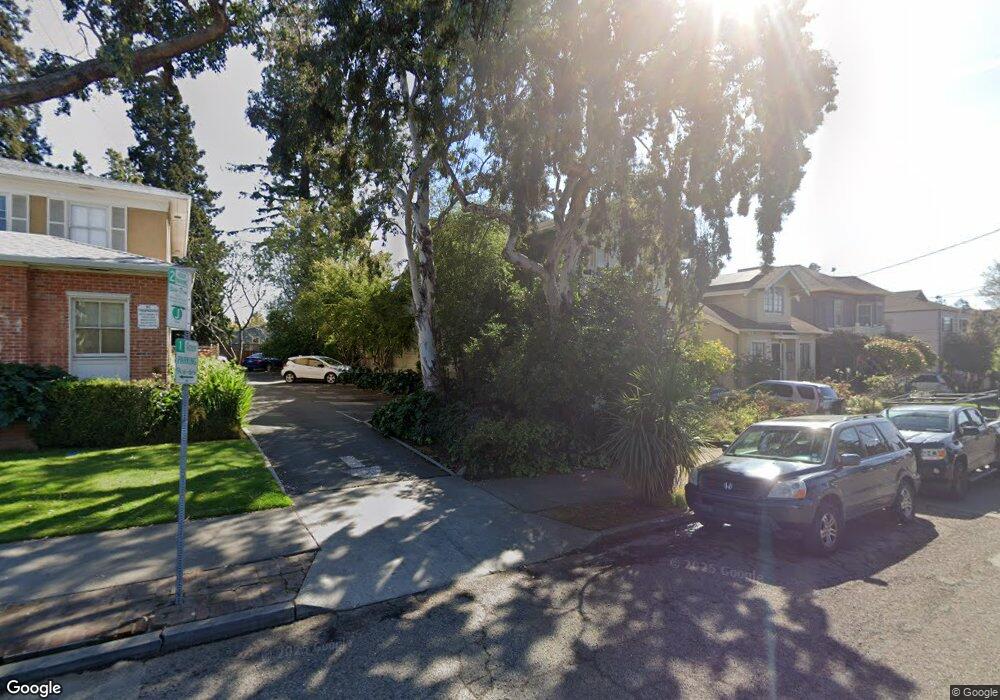
2328 Ward St Berkeley, CA 94705
South Berkeley NeighborhoodEstimated Value: $1,275,000 - $2,265,000
4
Beds
2
Baths
2,286
Sq Ft
$798/Sq Ft
Est. Value
About This Home
This home is located at 2328 Ward St, Berkeley, CA 94705 and is currently estimated at $1,825,036, approximately $798 per square foot. 2328 Ward St is a home located in Alameda County with nearby schools including Emerson Elementary School, Malcolm X Elementary School, and John Muir Elementary School.
Ownership History
Date
Name
Owned For
Owner Type
Purchase Details
Closed on
Oct 2, 2013
Sold by
Rittenberg Mark A
Bought by
Rittenberg Mark Alan and The Mark Rittenberg Trust
Current Estimated Value
Purchase Details
Closed on
Jul 12, 2011
Sold by
Rittenberg Penelope Kreitzer
Bought by
Rittenberg Mark A
Purchase Details
Closed on
Sep 19, 2003
Sold by
Rittenberg Penelope and Rittenberg Mark A
Bought by
Rittenberg Penelope
Home Financials for this Owner
Home Financials are based on the most recent Mortgage that was taken out on this home.
Original Mortgage
$301,000
Outstanding Balance
$120,327
Interest Rate
4.25%
Mortgage Type
Purchase Money Mortgage
Estimated Equity
$1,704,709
Create a Home Valuation Report for This Property
The Home Valuation Report is an in-depth analysis detailing your home's value as well as a comparison with similar homes in the area
Home Values in the Area
Average Home Value in this Area
Purchase History
| Date | Buyer | Sale Price | Title Company |
|---|---|---|---|
| Rittenberg Mark Alan | -- | None Available | |
| Rittenberg Mark A | -- | None Available | |
| Rittenberg Penelope | -- | Fidelity National Title Co |
Source: Public Records
Mortgage History
| Date | Status | Borrower | Loan Amount |
|---|---|---|---|
| Open | Rittenberg Penelope | $301,000 |
Source: Public Records
Tax History
| Year | Tax Paid | Tax Assessment Tax Assessment Total Assessment is a certain percentage of the fair market value that is determined by local assessors to be the total taxable value of land and additions on the property. | Land | Improvement |
|---|---|---|---|---|
| 2025 | $11,796 | $523,054 | $156,916 | $366,138 |
| 2024 | $11,796 | $512,800 | $153,840 | $358,960 |
| 2023 | $11,475 | $502,746 | $150,824 | $351,922 |
| 2022 | $11,662 | $492,888 | $147,866 | $345,022 |
| 2021 | $11,647 | $483,226 | $144,968 | $338,258 |
| 2020 | $10,944 | $478,273 | $143,482 | $334,791 |
| 2019 | $10,401 | $468,897 | $140,669 | $328,228 |
| 2018 | $10,155 | $459,704 | $137,911 | $321,793 |
| 2017 | $9,793 | $450,691 | $135,207 | $315,484 |
| 2016 | $9,359 | $441,854 | $132,556 | $309,298 |
| 2015 | $9,194 | $435,220 | $130,566 | $304,654 |
| 2014 | $9,007 | $426,697 | $128,009 | $298,688 |
Source: Public Records
Map
Nearby Homes
- 2319 Ward St
- 2702 Dana St
- 2917 Telegraph Ave
- 2550 Dana St Unit 2F
- 2243 Ashby Ave
- 2535 Chilton Way
- 2935 Florence St
- 2923 Wheeler St
- 2643 Stuart St
- 3046 Deakin St
- 2509 Dwight Way
- 2110 Ashby Ave
- 2018 Blake St
- 2057 Emerson St
- 2477 Prince St
- 2601 College Ave Unit 203
- 2601 College Ave Unit 208
- 2124 Prince St
- 6446 Colby St
- 1901 Parker St Unit 3
Your Personal Tour Guide
Ask me questions while you tour the home.