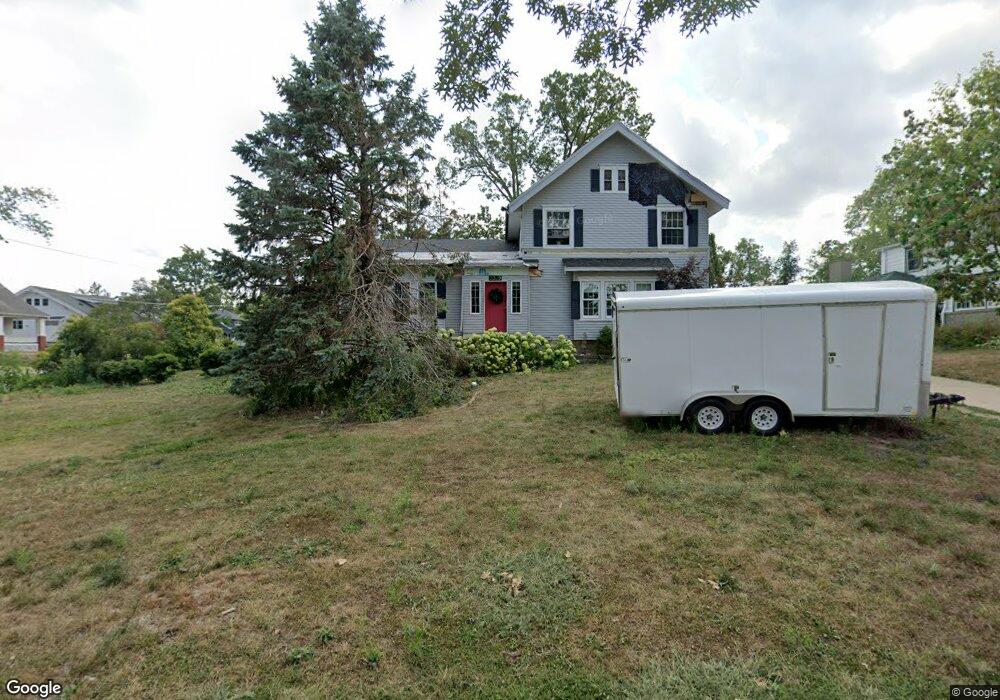
2329 Hillcrest Dr SE Cedar Rapids, IA 52403
Vernon Heights NeighborhoodEstimated Value: $327,666 - $465,000
4
Beds
4
Baths
2,857
Sq Ft
$133/Sq Ft
Est. Value
About This Home
This home is located at 2329 Hillcrest Dr SE, Cedar Rapids, IA 52403 and is currently estimated at $380,667, approximately $133 per square foot. 2329 Hillcrest Dr SE is a home located in Linn County with nearby schools including Grant Wood Elementary School, McKinley STEAM Academy, and George Washington High School.
Ownership History
Date
Name
Owned For
Owner Type
Purchase Details
Closed on
Oct 14, 2011
Sold by
Westpheling Karla
Bought by
Ellis Christopher Burke and Lindo Lorelle Lynn
Current Estimated Value
Home Financials for this Owner
Home Financials are based on the most recent Mortgage that was taken out on this home.
Original Mortgage
$252,000
Outstanding Balance
$172,039
Interest Rate
4.12%
Mortgage Type
New Conventional
Estimated Equity
$208,628
Purchase Details
Closed on
Sep 15, 2011
Sold by
Westphelling Jeffrey
Bought by
Westphelling Karla
Home Financials for this Owner
Home Financials are based on the most recent Mortgage that was taken out on this home.
Original Mortgage
$252,000
Outstanding Balance
$172,039
Interest Rate
4.12%
Mortgage Type
New Conventional
Estimated Equity
$208,628
Purchase Details
Closed on
Feb 28, 2002
Sold by
Wagner James R and Wagner Nancy E
Bought by
Westpheling Jeffrey A and Westpheling Karla L
Create a Home Valuation Report for This Property
The Home Valuation Report is an in-depth analysis detailing your home's value as well as a comparison with similar homes in the area
Home Values in the Area
Average Home Value in this Area
Purchase History
| Date | Buyer | Sale Price | Title Company |
|---|---|---|---|
| Ellis Christopher Burke | $283,500 | None Available | |
| Westphelling Karla | -- | None Available | |
| Westpheling Jeffrey A | $238,500 | -- |
Source: Public Records
Mortgage History
| Date | Status | Borrower | Loan Amount |
|---|---|---|---|
| Open | Ellis Christopher Burke | $252,000 |
Source: Public Records
Tax History Compared to Growth
Tax History
| Year | Tax Paid | Tax Assessment Tax Assessment Total Assessment is a certain percentage of the fair market value that is determined by local assessors to be the total taxable value of land and additions on the property. | Land | Improvement |
|---|---|---|---|---|
| 2025 | $5,260 | $352,900 | $76,800 | $276,100 |
| 2024 | $5,636 | $351,300 | $76,800 | $274,500 |
| 2023 | $5,636 | $297,200 | $69,400 | $227,800 |
| 2022 | $5,292 | $267,200 | $59,500 | $207,700 |
| 2021 | $5,862 | $255,500 | $59,500 | $196,000 |
| 2020 | $5,862 | $265,700 | $59,500 | $206,200 |
| 2019 | $5,454 | $253,000 | $59,500 | $193,500 |
| 2018 | $4,768 | $253,000 | $59,500 | $193,500 |
| 2017 | $5,156 | $244,500 | $59,500 | $185,000 |
| 2016 | $5,156 | $242,600 | $59,500 | $183,100 |
| 2015 | $5,276 | $247,918 | $59,462 | $188,456 |
| 2014 | $5,276 | $247,783 | $59,462 | $188,321 |
| 2013 | $5,160 | $247,783 | $59,462 | $188,321 |
Source: Public Records
Map
Nearby Homes
- 654 26th St SE
- 505 Forest Dr SE
- 2600 Mount Vernon Rd SE
- 637 Grant Wood Dr SE
- 2420 11th Ave SE
- 705 Grant Wood Dr SE
- 549 Vernon Dr SE
- 2323 Upland Dr SE
- 914 25th St SE
- 435 Forest Dr SE
- 520 22nd St SE
- 1929 Ridgeway Dr SE
- 510 Knollwood Dr SE
- 700 Memorial Dr SE
- 2251 Bever Ave SE
- 1911 Ridgeway Dr SE
- 1946 Higley Ave SE
- 1052 20th St SE
- 1117 Crestview Dr SE
- 1828 Mount Vernon Rd SE
- 2325 Hillcrest Dr SE
- 533 Forest Dr SE
- 2316 Hillcrest Dr SE
- 536 Forest Dr SE
- 2305 Hillcrest Dr SE
- 535 Forest Dr SE
- 538 Forest Dr SE
- 534 Forest Dr SE
- 540 Forest Dr SE
- 532 Forest Dr SE
- 542 Forest Dr SE
- 530 Forest Dr SE
- 544 Forest Dr SE
- 528 Forest Dr SE
- 539 Forest Dr SE
- 546 Forest Dr SE
- 2306 Hillcrest Dr SE
- 519 Forest Dr SE
- 540 Knollwood Dr SE
- 526 Forest Dr SE