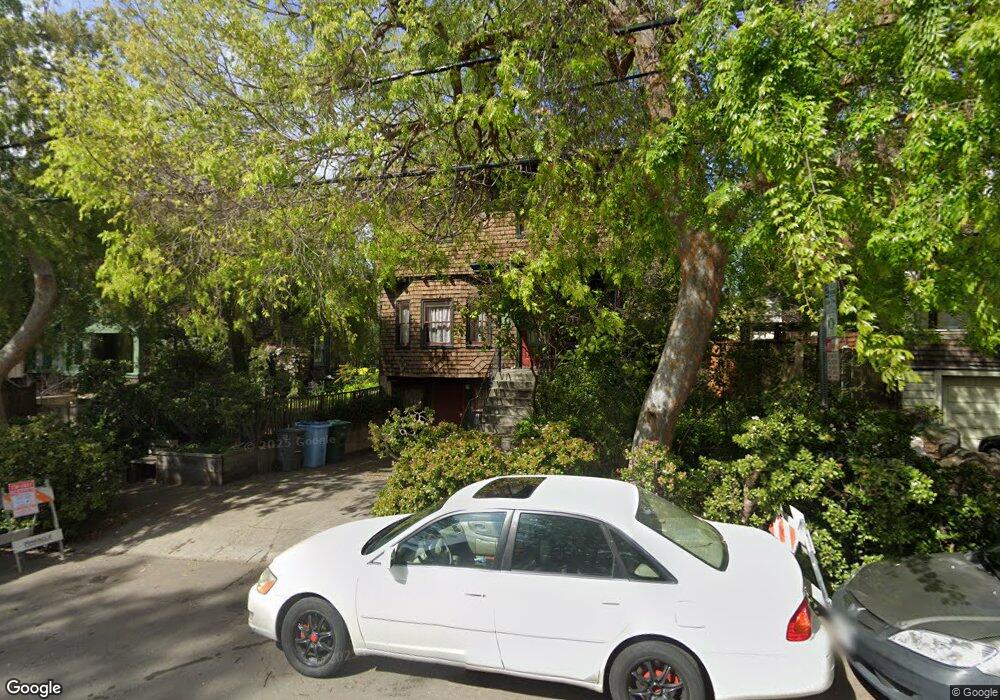
2329 Webster St Berkeley, CA 94705
South Berkeley NeighborhoodEstimated Value: $1,506,000 - $1,934,000
4
Beds
1
Bath
2,036
Sq Ft
$846/Sq Ft
Est. Value
About This Home
This home is located at 2329 Webster St, Berkeley, CA 94705 and is currently estimated at $1,722,077, approximately $845 per square foot. 2329 Webster St is a home located in Alameda County with nearby schools including Malcolm X Elementary School, Emerson Elementary School, and John Muir Elementary School.
Ownership History
Date
Name
Owned For
Owner Type
Purchase Details
Closed on
Dec 3, 2024
Sold by
John And Michelle Thelen Steere Living T and Steere John Thelen
Bought by
Steere John
Current Estimated Value
Purchase Details
Closed on
Jan 31, 2014
Sold by
Thelen Steere John and Thelen Steere Michelle
Bought by
Steere John Thelen and Thelen Steere Michelle
Purchase Details
Closed on
Oct 29, 2012
Sold by
Sopher Joshua E
Bought by
Sopher Joshua E and Joshua E Sopher Trust
Create a Home Valuation Report for This Property
The Home Valuation Report is an in-depth analysis detailing your home's value as well as a comparison with similar homes in the area
Home Values in the Area
Average Home Value in this Area
Purchase History
| Date | Buyer | Sale Price | Title Company |
|---|---|---|---|
| Steere John | -- | None Listed On Document | |
| Steere John Thelen | -- | None Available | |
| Sopher Joshua E | -- | None Available |
Source: Public Records
Tax History
| Year | Tax Paid | Tax Assessment Tax Assessment Total Assessment is a certain percentage of the fair market value that is determined by local assessors to be the total taxable value of land and additions on the property. | Land | Improvement |
|---|---|---|---|---|
| 2025 | $10,173 | $516,054 | $156,916 | $366,138 |
| 2024 | $10,173 | $505,800 | $153,840 | $358,960 |
| 2023 | $9,886 | $502,746 | $150,824 | $351,922 |
| 2022 | $9,609 | $485,888 | $147,866 | $345,022 |
| 2021 | $9,605 | $476,226 | $144,968 | $338,258 |
| 2020 | $9,020 | $478,273 | $143,482 | $334,791 |
| 2019 | $8,579 | $468,897 | $140,669 | $328,228 |
| 2018 | $8,401 | $459,704 | $137,911 | $321,793 |
| 2017 | $8,093 | $450,691 | $135,207 | $315,484 |
| 2016 | $7,761 | $441,854 | $132,556 | $309,298 |
| 2015 | $7,639 | $435,220 | $130,566 | $304,654 |
| 2014 | $7,567 | $426,697 | $128,009 | $298,688 |
Source: Public Records
Map
Nearby Homes
- 2243 Ashby Ave
- 3046 Deakin St
- 2917 Telegraph Ave
- 2923 Wheeler St
- 2935 Florence St
- 2110 Ashby Ave
- 2124 Prince St
- 629 66th St
- 6445 Irwin Ct
- 6446 Colby St
- 2477 Prince St
- 2057 Emerson St
- 2319 Ward St
- 556 Alcatraz Ave
- 2702 Dana St
- 6555 Shattuck Ave
- 360 Alcatraz Ave
- 667 & 667A Alcatraz Ave
- 667 Alcatraz Ave
- 6320 Shattuck Ave
- 2327 Webster St
- 2333 Webster St
- 2325 Webster St Unit D
- 2325 Webster St Unit C
- 2325 Webster St Unit A
- 2325 Webster St Unit B
- 2321 Webster St
- 2326 Webster St
- 2328 Webster St
- 2300 Ashby Ave
- 2298 Ashby Ave
- 2296 Ashby Ave
- 2320 Webster St
- 3039 Halcyon Ct
- 2292 Ashby Ave
- 2313 Webster St
- 2286 Ashby Ave
- 2318 Webster St
- 3030 Telegraph Ave
- 3041 Halcyon Ct
Your Personal Tour Guide
Ask me questions while you tour the home.