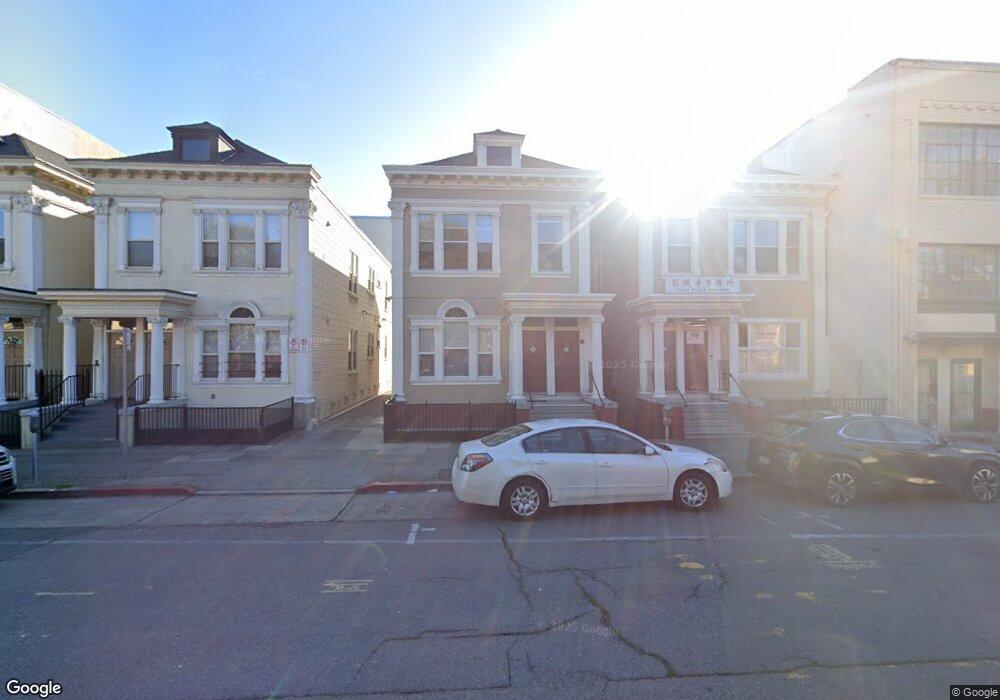
233 10th St Oakland, CA 94607
Chinatown NeighborhoodEstimated Value: $1,199,000 - $1,604,000
9
Beds
7
Baths
4,808
Sq Ft
$287/Sq Ft
Est. Value
About This Home
This home is located at 233 10th St, Oakland, CA 94607 and is currently estimated at $1,381,333, approximately $287 per square foot. 233 10th St is a home located in Alameda County with nearby schools including Lincoln Elementary School, Westlake Middle School, and Oakland Technical High School.
Ownership History
Date
Name
Owned For
Owner Type
Purchase Details
Closed on
Jun 16, 2017
Sold by
Pang Sharon and The Pang Revocable Inter Vivos
Bought by
Pang Sharon and Sharon Pang Revocable Trust
Current Estimated Value
Purchase Details
Closed on
Aug 5, 2006
Sold by
Siu Sylvia and Siu Calvin
Bought by
Siu Sylvia and Siu Calvin
Purchase Details
Closed on
Jan 19, 2005
Sold by
Pang Victor and Pang Sharon
Bought by
Pang Victor and Pang Sharon
Purchase Details
Closed on
Apr 27, 2004
Sold by
Abacus Asset Management Group Ltd
Bought by
Pang Victor and Pang Sharon
Home Financials for this Owner
Home Financials are based on the most recent Mortgage that was taken out on this home.
Original Mortgage
$632,000
Interest Rate
5.38%
Mortgage Type
Purchase Money Mortgage
Purchase Details
Closed on
Nov 22, 1995
Sold by
Chee Wah Quon and Chee Yuk Chun
Bought by
Abacus Asset Management Group Ltd
Purchase Details
Closed on
Dec 30, 1994
Sold by
Chee Wah Q and Chee Yuk C
Bought by
Chee Wah Quon and Chee Yuk Chun
Create a Home Valuation Report for This Property
The Home Valuation Report is an in-depth analysis detailing your home's value as well as a comparison with similar homes in the area
Home Values in the Area
Average Home Value in this Area
Purchase History
| Date | Buyer | Sale Price | Title Company |
|---|---|---|---|
| Pang Sharon | -- | None Available | |
| Siu Sylvia | -- | None Available | |
| Pang Victor | -- | -- | |
| Pang Victor | $860,000 | New Century Title Co | |
| Abacus Asset Management Group Ltd | -- | -- | |
| Chee Wah Quon | -- | -- |
Source: Public Records
Mortgage History
| Date | Status | Borrower | Loan Amount |
|---|---|---|---|
| Closed | Pang Victor | $632,000 |
Source: Public Records
Tax History
| Year | Tax Paid | Tax Assessment Tax Assessment Total Assessment is a certain percentage of the fair market value that is determined by local assessors to be the total taxable value of land and additions on the property. | Land | Improvement |
|---|---|---|---|---|
| 2025 | $19,333 | $1,222,670 | $366,801 | $855,869 |
| 2024 | $19,333 | $1,198,701 | $359,610 | $839,091 |
| 2023 | $20,100 | $1,175,198 | $352,559 | $822,639 |
| 2022 | $19,402 | $1,152,158 | $345,647 | $806,511 |
| 2021 | $18,375 | $1,129,574 | $338,872 | $790,702 |
| 2020 | $18,014 | $1,118,000 | $335,400 | $782,600 |
| 2019 | $17,264 | $1,096,078 | $328,823 | $767,255 |
| 2018 | $16,900 | $1,074,587 | $322,376 | $752,211 |
| 2017 | $16,213 | $1,055,057 | $316,055 | $739,002 |
| 2016 | $15,797 | $1,034,400 | $309,858 | $724,542 |
| 2015 | $15,717 | $1,018,884 | $305,203 | $713,681 |
| 2014 | $16,252 | $998,958 | $299,225 | $699,733 |
Source: Public Records
Map
Nearby Homes
- 1009 Madison St
- 185 7th St
- 625 Madison St Unit 107
- 602 Alice St
- 184 13th St
- 988 Franklin St Unit 707
- 988 Franklin St Unit 601
- 988 Franklin St Unit 710
- 989 Webster St Unit 443
- 989 Webster St Unit 450
- 989 Webster St
- 428 Alice St Unit 304
- 428 Alice St Unit 336
- 330 13th St Unit 5C
- 410 Webster St Unit 1
- 201 4th St Unit 408
- 801 Franklin St Unit 1119
- 801 Franklin St Unit 205
- 801 Franklin St Unit 1239
- 1425 Lakeside Dr Unit 101
Your Personal Tour Guide
Ask me questions while you tour the home.