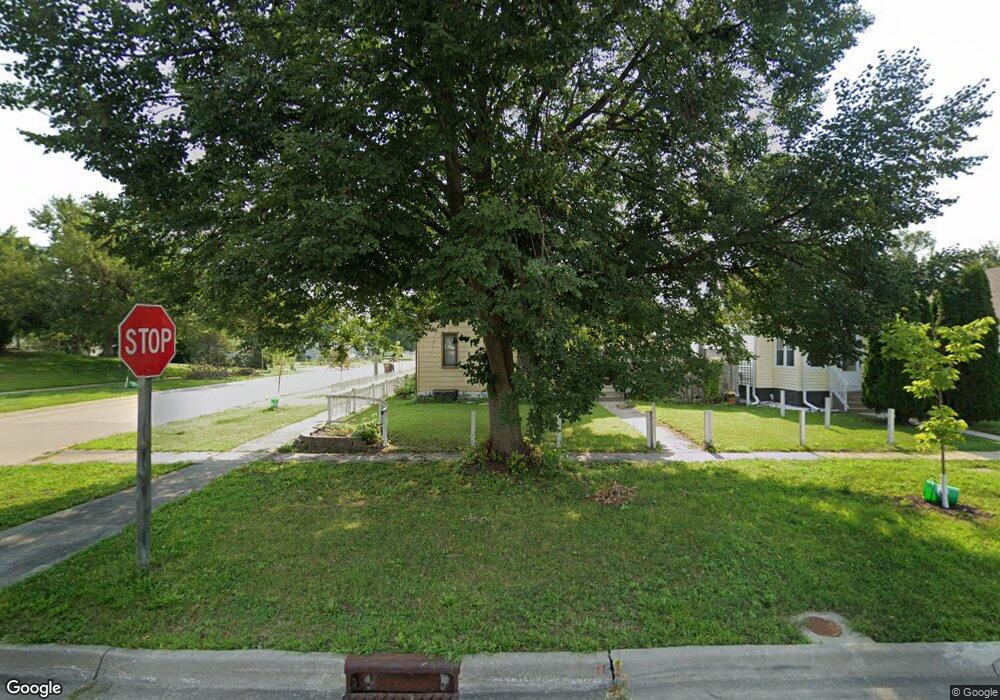
233 3rd St West Des Moines, IA 50265
Estimated Value: $189,000 - $202,000
2
Beds
1
Bath
996
Sq Ft
$197/Sq Ft
Est. Value
About This Home
This home is located at 233 3rd St, West Des Moines, IA 50265 and is currently estimated at $196,605, approximately $197 per square foot. 233 3rd St is a home located in Polk County with nearby schools including Hillside Elementary School, Stilwell Junior High School, and Valley Southwoods Freshman High School.
Ownership History
Date
Name
Owned For
Owner Type
Purchase Details
Closed on
Oct 16, 2024
Sold by
Hartley Deborah
Bought by
Hartley Deborah and Hartley Rick
Current Estimated Value
Purchase Details
Closed on
Aug 21, 2008
Sold by
Hartley Deborah and Hartley Rick
Bought by
Hartley Deborah
Home Financials for this Owner
Home Financials are based on the most recent Mortgage that was taken out on this home.
Original Mortgage
$70,035
Interest Rate
6.2%
Mortgage Type
FHA
Purchase Details
Closed on
Feb 17, 2000
Sold by
Hartley Deborah
Bought by
Hartley Rick and Hartley Deborah
Home Financials for this Owner
Home Financials are based on the most recent Mortgage that was taken out on this home.
Original Mortgage
$58,125
Interest Rate
11.25%
Purchase Details
Closed on
Jan 8, 1999
Sold by
Hartley Deborah and The Estate Of Treva J Cox
Bought by
Hartley Deborah
Create a Home Valuation Report for This Property
The Home Valuation Report is an in-depth analysis detailing your home's value as well as a comparison with similar homes in the area
Home Values in the Area
Average Home Value in this Area
Purchase History
| Date | Buyer | Sale Price | Title Company |
|---|---|---|---|
| Hartley Deborah | -- | None Listed On Document | |
| Hartley Deborah | -- | None Listed On Document | |
| Hartley Deborah | -- | First American Title | |
| Hartley Rick | -- | -- | |
| Hartley Deborah | -- | -- |
Source: Public Records
Mortgage History
| Date | Status | Borrower | Loan Amount |
|---|---|---|---|
| Previous Owner | Hartley Deborah | $70,035 | |
| Previous Owner | Hartley Rick | $58,125 |
Source: Public Records
Tax History Compared to Growth
Tax History
| Year | Tax Paid | Tax Assessment Tax Assessment Total Assessment is a certain percentage of the fair market value that is determined by local assessors to be the total taxable value of land and additions on the property. | Land | Improvement |
|---|---|---|---|---|
| 2025 | $2,396 | $180,900 | $45,100 | $135,800 |
| 2024 | $2,396 | $168,600 | $41,800 | $126,800 |
| 2023 | $2,342 | $168,600 | $41,800 | $126,800 |
| 2022 | $2,228 | $130,200 | $33,600 | $96,600 |
| 2021 | $2,092 | $125,700 | $33,600 | $92,100 |
| 2020 | $2,056 | $112,900 | $30,300 | $82,600 |
| 2019 | $1,880 | $112,900 | $30,300 | $82,600 |
| 2018 | $1,880 | $100,300 | $26,800 | $73,500 |
| 2017 | $1,826 | $100,300 | $26,800 | $73,500 |
| 2016 | $1,782 | $94,900 | $25,100 | $69,800 |
| 2015 | $1,782 | $94,900 | $25,100 | $69,800 |
| 2014 | $1,712 | $90,600 | $23,700 | $66,900 |
Source: Public Records
Map
Nearby Homes