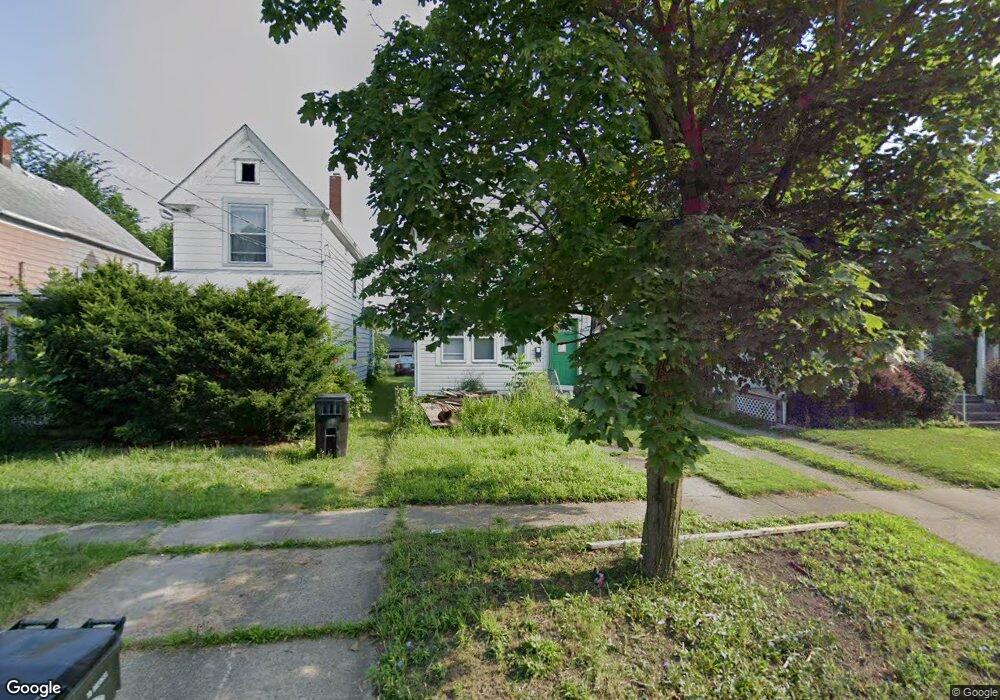
233 Bath St Elyria, OH 44035
Estimated Value: $188,000 - $310,000
3
Beds
1
Bath
1,340
Sq Ft
$174/Sq Ft
Est. Value
About This Home
This home is located at 233 Bath St, Elyria, OH 44035 and is currently estimated at $233,667, approximately $174 per square foot. 233 Bath St is a home located in Lorain County with nearby schools including Westwood Middle School, Elyria High School, and St Mary Elementary School.
Ownership History
Date
Name
Owned For
Owner Type
Purchase Details
Closed on
Aug 26, 2021
Sold by
Stammitti Phil R
Bought by
Talarek Daniel J
Current Estimated Value
Purchase Details
Closed on
Jul 18, 1994
Sold by
Flood Lillian
Bought by
Flood Mark A and Flood Kimberly M
Home Financials for this Owner
Home Financials are based on the most recent Mortgage that was taken out on this home.
Original Mortgage
$12,600
Interest Rate
8.6%
Mortgage Type
New Conventional
Create a Home Valuation Report for This Property
The Home Valuation Report is an in-depth analysis detailing your home's value as well as a comparison with similar homes in the area
Home Values in the Area
Average Home Value in this Area
Purchase History
| Date | Buyer | Sale Price | Title Company |
|---|---|---|---|
| Talarek Daniel J | $24,446 | None Available | |
| Flood Mark A | $14,000 | -- |
Source: Public Records
Mortgage History
| Date | Status | Borrower | Loan Amount |
|---|---|---|---|
| Previous Owner | Flood Mark A | $12,600 |
Source: Public Records
Tax History
| Year | Tax Paid | Tax Assessment Tax Assessment Total Assessment is a certain percentage of the fair market value that is determined by local assessors to be the total taxable value of land and additions on the property. | Land | Improvement |
|---|---|---|---|---|
| 2024 | $187 | $3,185 | $3,185 | -- |
| 2023 | $205 | $2,944 | $2,944 | $0 |
| 2022 | $1,604 | $2,944 | $2,944 | $0 |
| 2021 | $1,578 | $28,396 | $2,944 | $25,452 |
| 2020 | $1,483 | $23,710 | $2,460 | $21,250 |
| 2019 | $1,474 | $23,710 | $2,460 | $21,250 |
| 2018 | $1,477 | $23,710 | $2,460 | $21,250 |
| 2017 | $1,389 | $21,340 | $1,730 | $19,610 |
| 2016 | $1,338 | $21,340 | $1,730 | $19,610 |
| 2015 | $1,254 | $21,340 | $1,730 | $19,610 |
| 2014 | $1,369 | $22,460 | $1,820 | $20,640 |
| 2013 | $1,291 | $22,460 | $1,820 | $20,640 |
Source: Public Records
Map
Nearby Homes
Your Personal Tour Guide
Ask me questions while you tour the home.