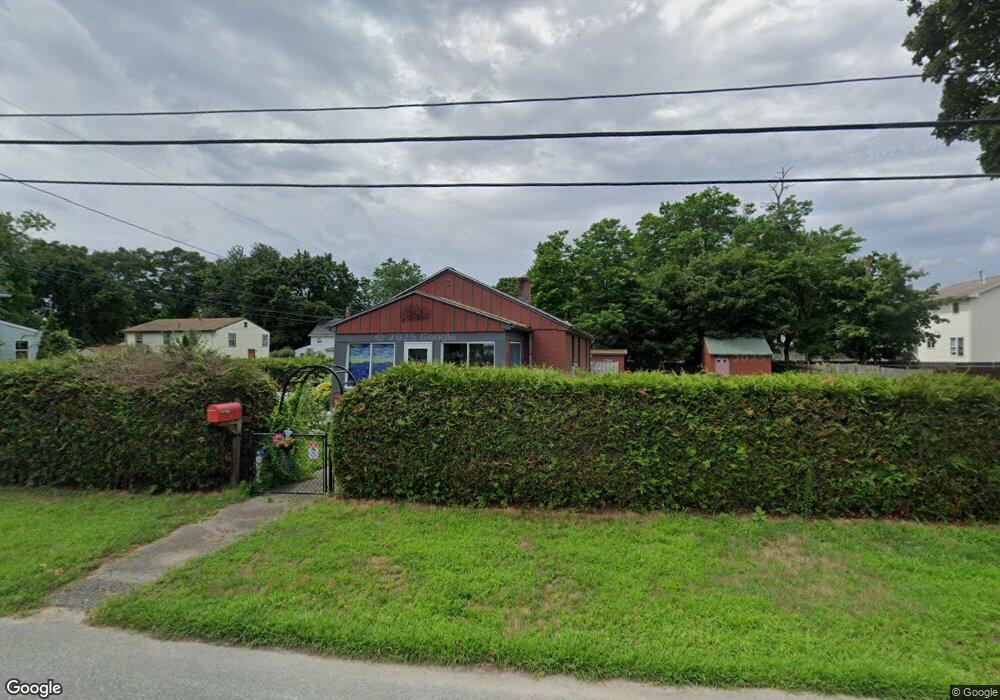
233 Bellman Ave Warwick, RI 02889
Conimicut-Shawomet NeighborhoodEstimated Value: $323,000 - $364,000
2
Beds
1
Bath
1,692
Sq Ft
$201/Sq Ft
Est. Value
About This Home
This home is located at 233 Bellman Ave, Warwick, RI 02889 and is currently estimated at $340,293, approximately $201 per square foot. 233 Bellman Ave is a home located in Kent County with nearby schools including Saint Kevin School and Bishop Hendricken High School.
Ownership History
Date
Name
Owned For
Owner Type
Purchase Details
Closed on
Sep 15, 2006
Sold by
Howell Joanne and Howell Randy K
Bought by
Laprade Vincent G and Perry Barbara A
Current Estimated Value
Home Financials for this Owner
Home Financials are based on the most recent Mortgage that was taken out on this home.
Original Mortgage
$197,910
Interest Rate
6.71%
Mortgage Type
Purchase Money Mortgage
Purchase Details
Closed on
Dec 19, 2005
Sold by
Capoverde Frank S
Bought by
Howell Joanne
Home Financials for this Owner
Home Financials are based on the most recent Mortgage that was taken out on this home.
Original Mortgage
$164,800
Interest Rate
6.34%
Mortgage Type
Purchase Money Mortgage
Create a Home Valuation Report for This Property
The Home Valuation Report is an in-depth analysis detailing your home's value as well as a comparison with similar homes in the area
Home Values in the Area
Average Home Value in this Area
Purchase History
| Date | Buyer | Sale Price | Title Company |
|---|---|---|---|
| Laprade Vincent G | $220,000 | -- | |
| Howell Joanne | $206,000 | -- |
Source: Public Records
Mortgage History
| Date | Status | Borrower | Loan Amount |
|---|---|---|---|
| Previous Owner | Howell Joanne | $197,910 | |
| Previous Owner | Howell Joanne | $164,800 | |
| Previous Owner | Howell Joanne | $20,600 |
Source: Public Records
Tax History
| Year | Tax Paid | Tax Assessment Tax Assessment Total Assessment is a certain percentage of the fair market value that is determined by local assessors to be the total taxable value of land and additions on the property. | Land | Improvement |
|---|---|---|---|---|
| 2025 | $3,747 | $295,000 | $123,600 | $171,400 |
| 2024 | $3,636 | $251,300 | $118,800 | $132,500 |
| 2023 | $3,566 | $251,300 | $118,800 | $132,500 |
| 2022 | $3,250 | $173,500 | $73,500 | $100,000 |
| 2021 | $3,250 | $173,500 | $73,500 | $100,000 |
| 2020 | $3,250 | $173,500 | $73,500 | $100,000 |
| 2019 | $3,250 | $173,500 | $73,500 | $100,000 |
| 2018 | $2,568 | $138,600 | $73,500 | $65,100 |
| 2017 | $2,805 | $138,600 | $73,500 | $65,100 |
| 2016 | $2,805 | $138,600 | $73,500 | $65,100 |
| 2015 | $2,561 | $123,400 | $62,100 | $61,300 |
| 2014 | $2,475 | $123,400 | $62,100 | $61,300 |
| 2013 | $2,442 | $123,400 | $62,100 | $61,300 |
Source: Public Records
Map
Nearby Homes
Your Personal Tour Guide
Ask me questions while you tour the home.